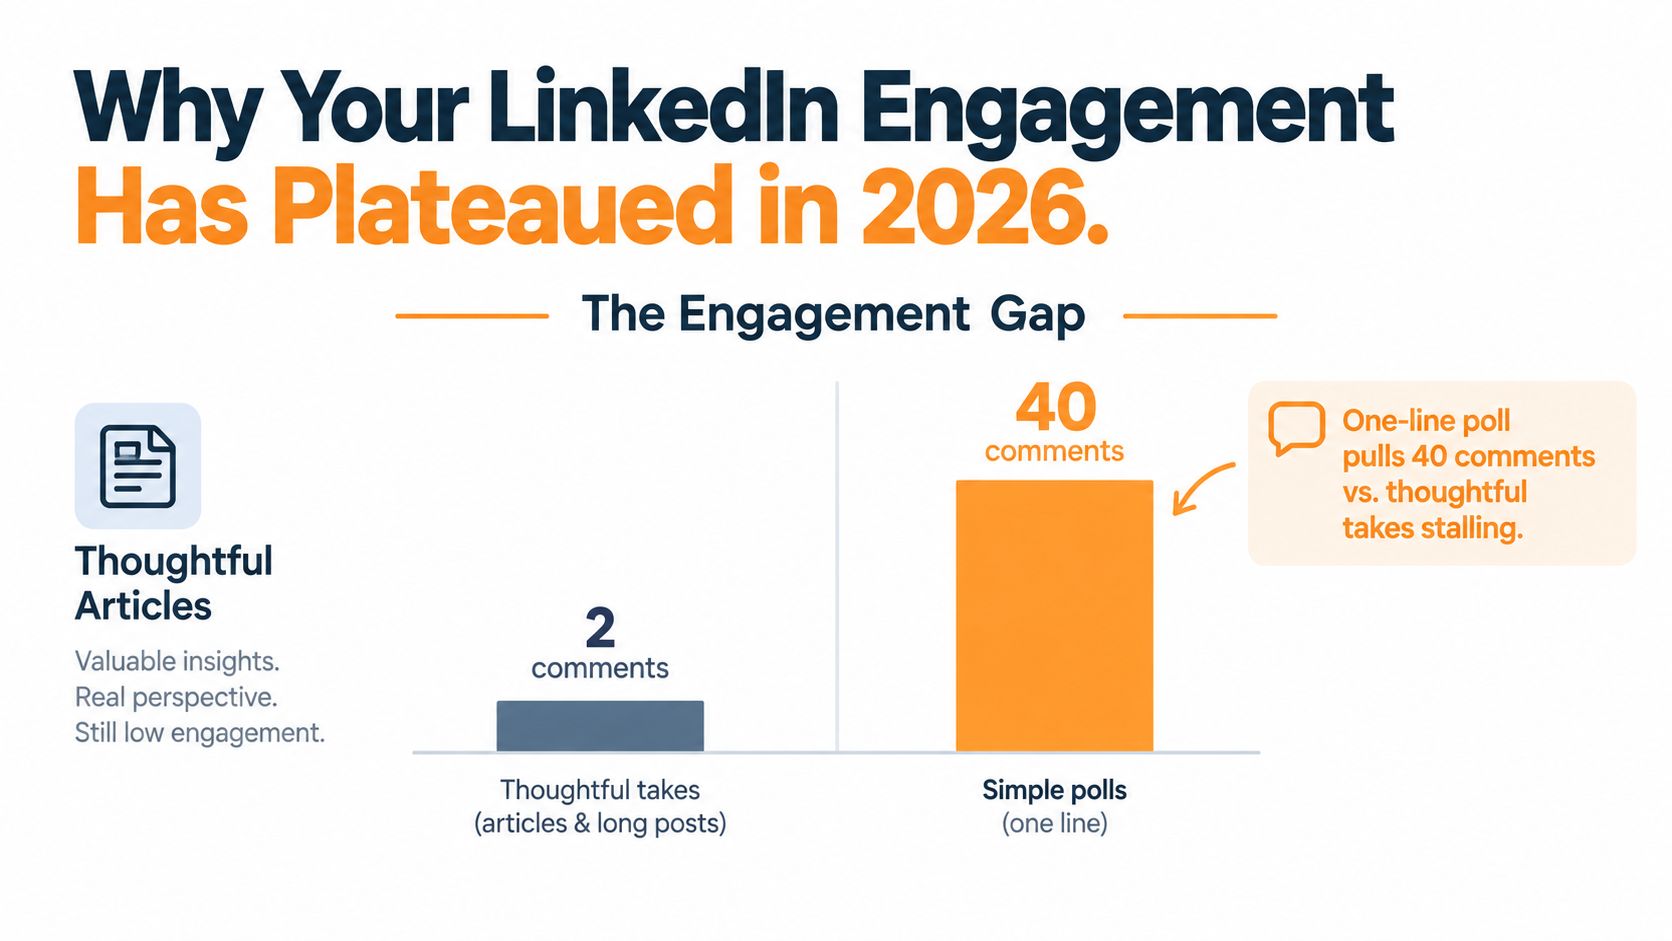
You publish three thoughtful LinkedIn posts every week. You spend time on the insight, polish the wording, and add a useful takeaway. Then someone drops a one-line poll and collects a comment section that makes your post look invisible.
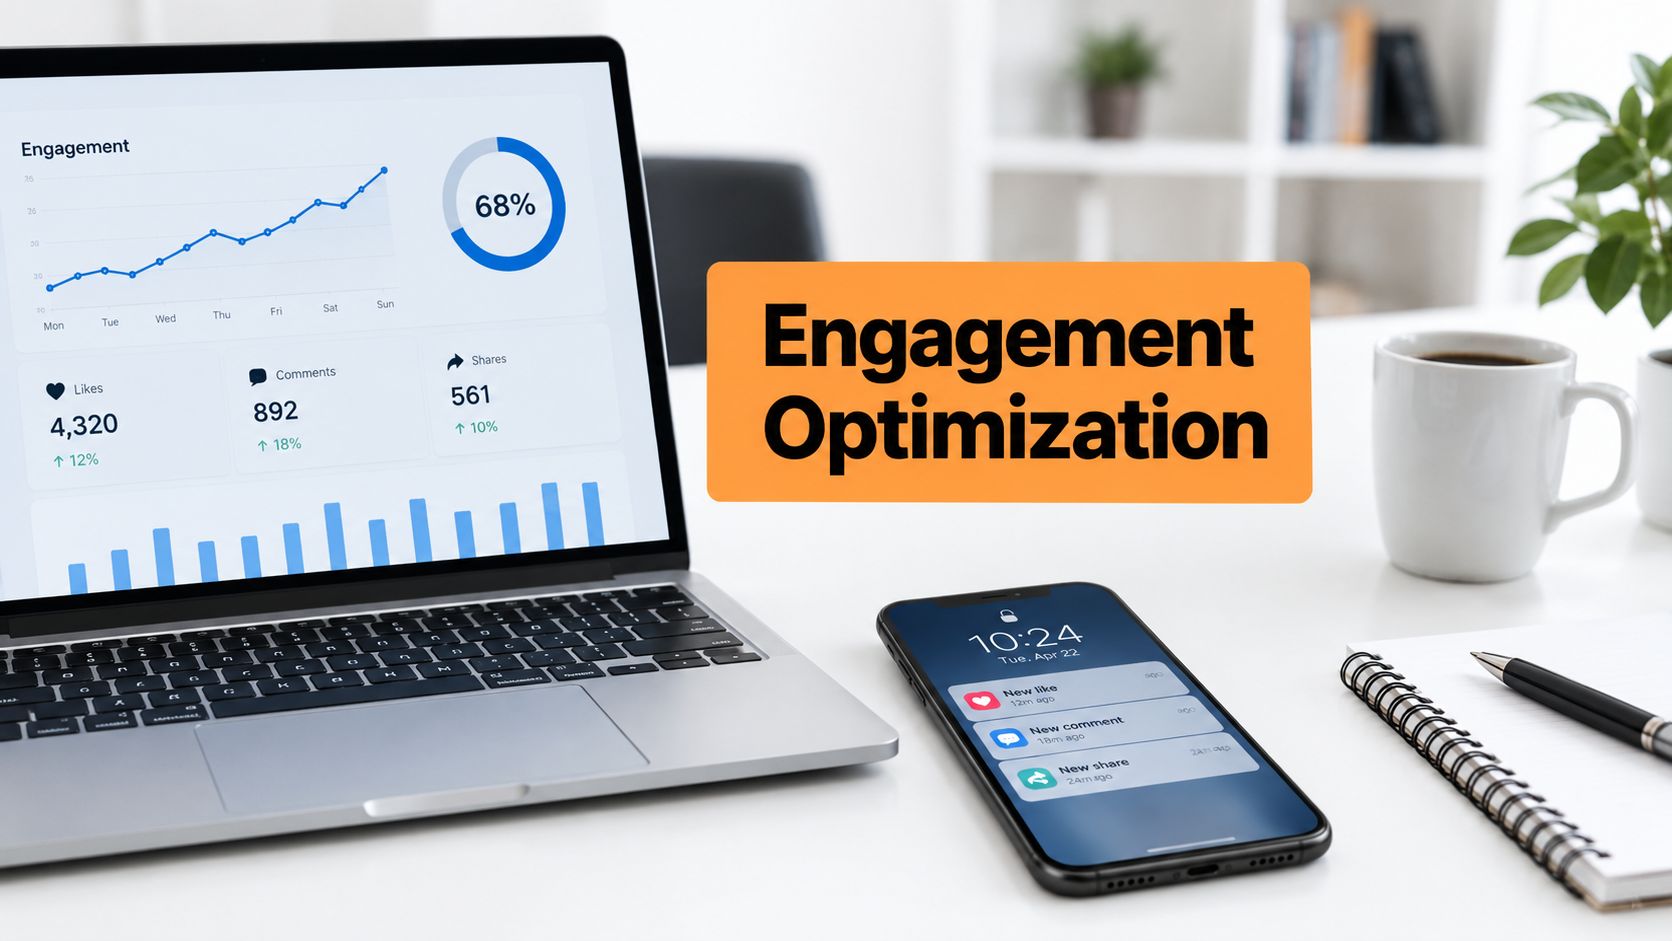
That gap feels personal, but it usually isn't. LinkedIn post engagement has split into different types of behavior, and likes, comments, clicks, video views, profile visits, and reposts don't tell the same story. If you measure only visible reactions, you can mistake a quiet but commercially useful post for a failure.
Why Your LinkedIn Engagement Has Plateaued in 2026
The old advice was simple: stay consistent, post often, and invite discussion. That advice is incomplete now. A large Socialinsider LinkedIn benchmark, based on 1.3 million posts from 16,645 business pages, recorded average engagement of 5.20% in 2026, up 8% year over year. The same benchmark found that native document posts averaged 7.00%, while link posts averaged 3.25%.
The important point isn't that one format always wins. It's that format changes the kind of response your post can generate. A document can earn reading time, saves, and shares. A short text post can create replies. A link post may generate clicks without producing many public reactions. Treating those outcomes as one score makes your reporting less useful.
Stop grading every post by likes
Metricool's 2026 LinkedIn study covered 673,658 posts across 63,108 accounts and reported year-over-year declines in likes, comments, and shares, while total engagement rose by about 14% as clicks, video views, and other interactions increased. That divergence changes the question you should ask after publishing.
Don't ask, “Why didn't this get more likes?” Ask:
- Did the right people click through?
- Did viewers continue watching?
- Did the post create relevant replies?
- Did profile visits or follows increase?
- Did someone save or privately share the idea?
A simple poll may create visible activity without building authority. A technical post may attract fewer reactions while reaching the exact buyer, operator, or candidate you want. Your dashboard needs to separate attention, conversation, consumption, and intent.
Hashtag stacks, daily filler posts, and broad “tag everyone you know” threads are poor substitutes for a clear idea. Use native formats when the content deserves attention, write for a specific audience, and measure the action that matches your business objective.
What LinkedIn Post Engagement Really Measures
LinkedIn post engagement is the set of actions people take after LinkedIn distributes a post. That includes reactions, comments, replies, reposts, profile visits, follows, link clicks, video views, and other forms of content consumption.
Those actions fall into three practical families.
| Metric Family | Examples | Algorithm Signal | 2026 Weight |
|---|---|---|---|
| Surface reactions | Like, support, love, insight | Immediate approval or recognition | Benchmark varies by format |
| Conversation signals | Comments, replies, reposts, direct messages | Active participation and sharing | Track separately |
| Consumption signals | Clicks, video views, reading time, completion | Attention and deeper interest | Track separately |
The table isn't a claim that LinkedIn publishes a fixed weighting formula. It's a reporting model. Public benchmarks show that formats produce different outcomes, so you shouldn't combine every action into one unqualified “engagement” number.
Read the signal behind the action
A reaction is easy to give and useful as a broad awareness indicator. A comment requires more effort, especially when it adds an example, disagreement, or question. A repost puts the reader's reputation beside your idea, which makes it a stronger distribution signal for many content strategies.
Clicks and video views need context. A click can mean genuine interest, accidental tapping, or immediate abandonment. A view can mean a brief start or meaningful completion. Measure the action alongside the post's purpose, rather than treating every interaction as equally valuable.
For a practical explanation of the difference between impressions and views, use this guide to LinkedIn impressions versus views. It helps prevent a common reporting error, comparing the number of times content was displayed with the number of people who consumed it.
Measurement rule: Pick one primary action before you publish. A post designed to start a debate should be judged by qualified comments, not by the click rate of a post designed to drive traffic.
The 2026 Engagement Numbers by Post Format
Format selection now deserves a place in your editorial strategy. The verified benchmark data gives you useful averages, but it doesn't provide a complete reaction, comment, repost, and dwell-time breakdown for every format. Don't fill those gaps with invented precision.
The 2026 Socialinsider benchmark reports average engagement of 5.20%, with native document posts at 7.00%, multi-image posts at 6.45%, video at 6.00%, images at 5.30%, text-only posts at 4.50%, polls at 4.20%, and link posts at 3.25%. It also reports year-over-year growth for native documents, videos, images, and text posts.
| Post Format | Avg Reaction Rate | Avg Comment Rate | Avg Repost Rate | Dwell-Time Index |
|---|---|---|---|---|
| Native document | Not reported separately | Not reported separately | Not reported separately | Not reported as an index |
| Multi-image | Not reported separately | Not reported separately | Not reported separately | Not reported as an index |
| Video | Not reported separately | Not reported separately | Not reported separately | Not reported as an index |
| Image | Not reported separately | Not reported separately | Not reported separately | Not reported as an index |
| Text-only | Not reported separately | Not reported separately | Not reported separately | Not reported as an index |
| Poll | Not reported separately | Not reported separately | Not reported separately | Not reported as an index |
| Link post | Not reported separately | Not reported separately | Not reported separately | Not reported as an index |
What the averages actually tell you
Native documents are the clearest format test. They lead the verified benchmark, so use them for frameworks, checklists, teardown posts, and practical education. Put one idea on each page and make the opening page valuable enough to earn the next swipe.
Video is a serious option, not a guaranteed shortcut. Its average engagement sits above text-only posts in the benchmark, but your success depends on the quality of the opening, the clarity of the spoken idea, and whether viewers can understand it without sound.
Text still has a job. At 4.50%, it isn't obsolete. It works best when the first lines state a specific tension, lesson, or opinion instead of warming up with generic professional language.
Link posts rank lowest in this benchmark. If traffic matters, make the post useful on LinkedIn first and treat the click as a separate conversion objective.
Writing and Structure Moves That Lift Comments and Shares
Comments don't appear because you added “What do you think?” to the final line. People comment when you give them a clear position to support, challenge, extend, or apply.
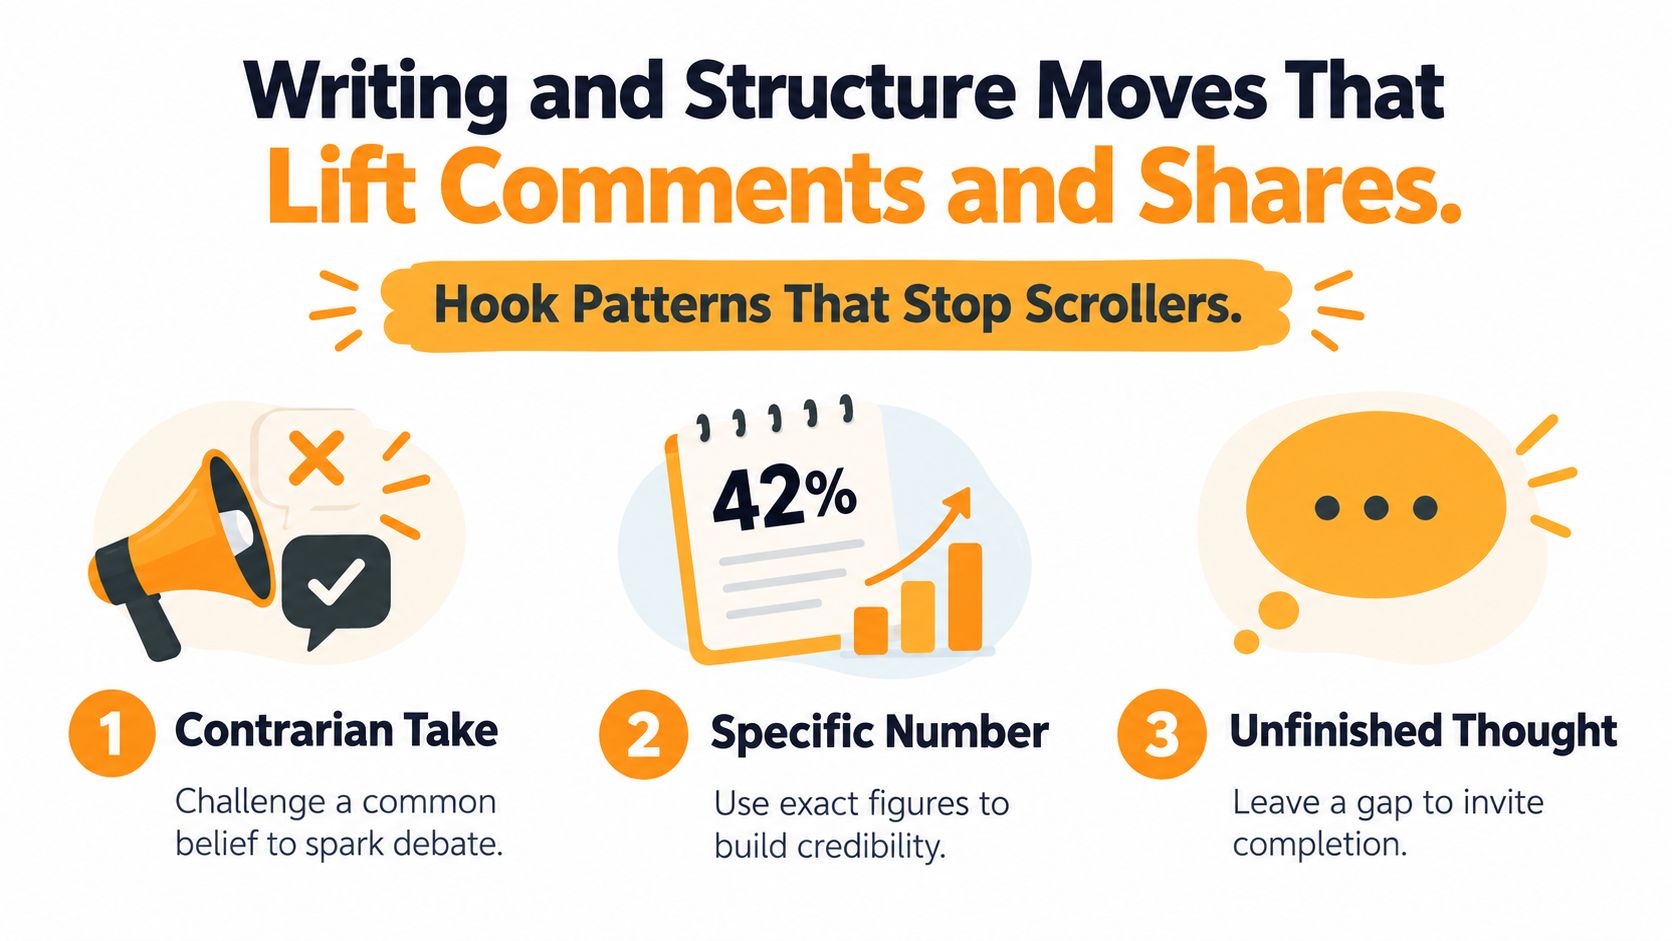
Start with a first line that creates an information gap. Three reliable patterns are:
- Contrarian take: “Most content calendars create consistency, but they also create forgettable posts.”
- Specific number: Use a verified figure when it supports the point, such as the 7.00% average engagement for native documents in the Socialinsider benchmark.
- Unfinished story: “The post looked successful until we checked the clicks.”
Make the post easy to enter
Write in short paragraphs, but don't turn every sentence into theatrical “bro-etry.” Give each paragraph one job: establish the problem, explain the cause, show the implication, and offer a practical response.
Then make the prompt narrow. “What do you think?” asks the reader to invent the conversation. “Which creates more qualified conversations for you, a document or a text post?” gives them an obvious way in.
Research analyzing 991 LinkedIn posts found that hashtags and tags significantly increased expected reactions, while tags also substantially increased comments. It also found spillover between metrics, with comments associated with reactions and reposts, and reactions associated with comments and reposts. You can review the study's findings on hashtags, tags, and LinkedIn content, but apply them with restraint.
Use relevant tags when a person contributes to the topic. Avoid tagging a crowd just to manufacture notifications. Add only hashtags that clarify the subject, and never replace a precise argument with a wall of labels.
A defensible mistake can invite correction, but don't fabricate errors. State a position you can explain, leave room for disagreement, and respond to the first useful comment with a follow-up question. For drafting and testing variations, an AI tool for writing LinkedIn posts can help you compare openings while you keep editorial control.
Posting Cadence and Account Size Are Quietly Killing Your Reach
Posting more is not a strategy. It's a production decision, and it can damage your results when the quality, topic focus, or audience attention can't keep up.
One 2026 analysis found that four to five posts per week produced the highest engagement rate and 28% more impressions per post than posting once weekly. It also found that eight or more posts per week caused engagement and impressions to drop sharply. Those figures support a practical conclusion: test a sustainable rhythm, then stop increasing volume when each post starts competing with the previous one.
The same analysis found that profiles with 1,001 to 5,000 followers had the highest median engagement rate at 2.68%, while profiles above 100,000 followers averaged 1.53%. The posting cadence and account-size analysis is useful because it challenges the assumption that a larger audience automatically produces stronger per-post engagement.
| Connection Count | Posts Per Week | Avg Engagement Rate Lift |
|---|---|---|
| 1,001 to 5,000 followers | Four to five | Highest median rate in the cited analysis, 2.68% |
| Above 100,000 followers | Not specified as a recommendation | Median rate of 1.53% |
| Any account | Eight or more | Engagement and impressions dropped sharply |
| Any account | Once weekly | Four to five posts produced 28% more impressions per post |
Use cadence as a quality control
Start with four posts per week if you can maintain original thinking. Reduce the schedule if your comments become repetitive, your topics become scattered, or you're publishing because the calendar says so.
Watch for warning signs:
- Comments decline: Your audience may be seeing too much similar content.
- Posts feel rushed: Your hooks become generic and your examples disappear.
- Profile views rise without meaningful reactions: People may be curious, but the post isn't creating public participation.
- Your topics sprawl: The audience no longer knows why to follow you.
Don't copy a cadence from a much larger creator. Your account size, niche, workload, and content quality matter more than a universal posting rule. For a deeper planning framework, use this resource on what posting cadence means for content strategy.
A Real Post Rewrite That Doubled Engagement
A real case study would require verified source material. The brief doesn't provide a citable case study, so the following is a composite rewrite example, not a claim about an actual account or performance result.
The original announcement is familiar:
“We're excited to announce our new LinkedIn content service. Our team has worked hard to create a solution that helps businesses improve their social media presence. Learn more about how we can support your goals.”
It isn't offensive. It's slow. The value appears late, the audience isn't named, and the final invitation asks people to leave LinkedIn before they understand why the offer matters.
Put the value before the announcement
A sharper version could read:
Most LinkedIn content fails before the second line.
Not because the idea is weak.
Because the post opens with an announcement instead of the problem the reader wants solved.
We rebuilt our content service around one rule: lead with the useful insight, then introduce the offer.
What do you remove first when a post feels flat, the opening, the format, or the CTA?
This rewrite uses a six-line structure, a clear opinion, and a focused prompt. It doesn't promise a result it can't prove. It gives the reader something worth discussing before presenting a service.
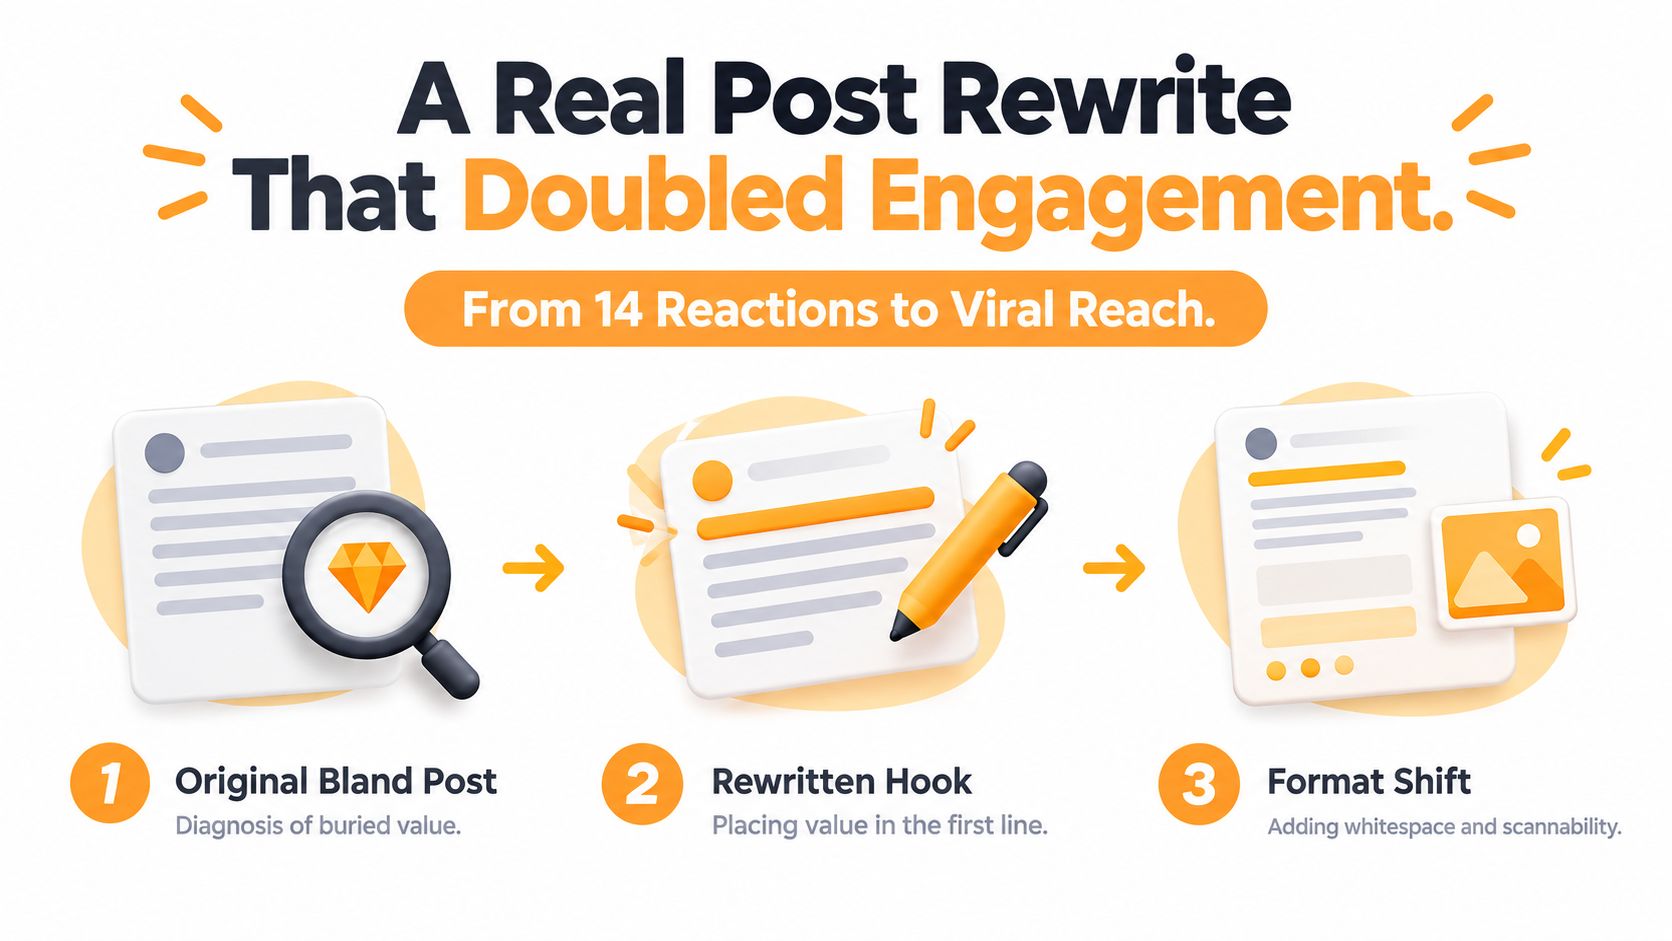
The reusable template is straightforward:
- Opening: Name the mistake or tension.
- Development: Explain what people misunderstand.
- Proof: Add an example, observation, or verified benchmark.
- Application: State what you changed.
- Prompt: Ask for one specific response.
Before you rewrite, ask three questions:
- Does the first line earn the next line?
- Is the ask specific enough to answer quickly?
- Can you remove one sentence without losing meaning?
For a visual walkthrough of the same optimization logic, watch the embedded example below.
The point isn't to manufacture virality. A good rewrite makes the post easier to understand, easier to enter, and more relevant to the people you want in the conversation.
Measuring LinkedIn Post Engagement the Right Way
Your measurement system doesn't need to be complicated. It needs to separate distribution from response and public activity from commercial intent.
Use three layers.
Layer one uses native analytics
Record impressions, reactions, comments, reposts, clicks, profile visits, and follower changes for each post. Keep the format, topic, opening style, and publishing date beside those figures. Without that context, you can't tell whether a document worked because of its format or because the subject was unusually relevant.
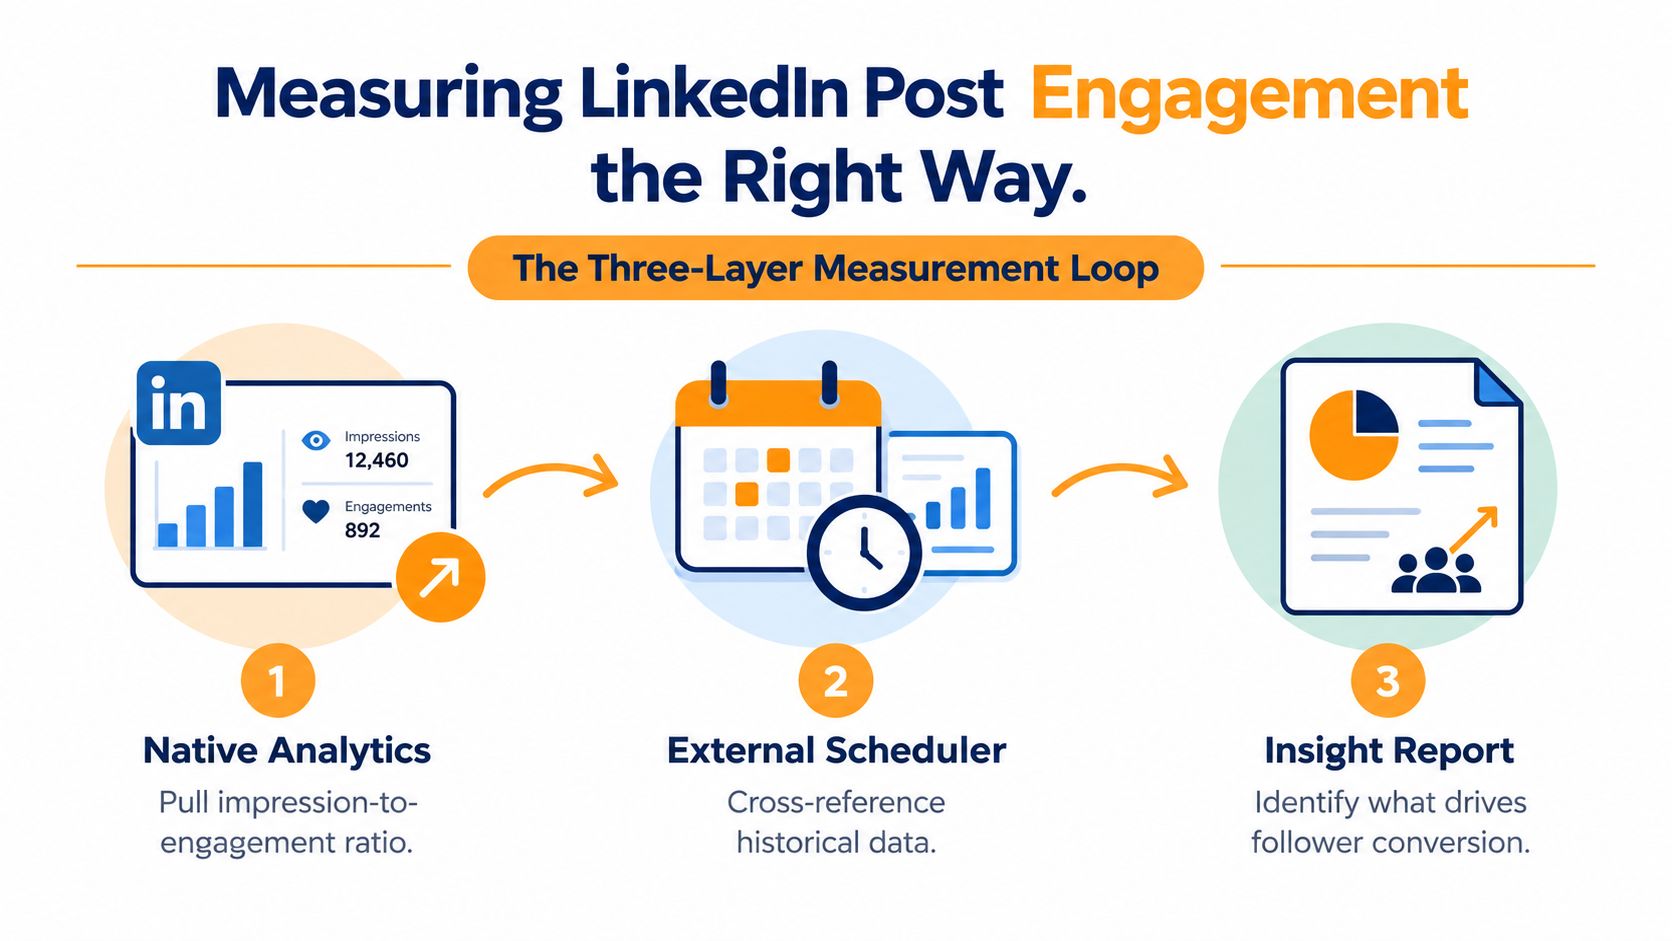
Layer two adds historical comparison
Use a scheduler or reporting dashboard to compare similar posts over time. Don't compare a technical document with a broad personal story and call the difference a format result. Group posts by format, subject, audience, and objective.
Layer three records qualitative evidence
Keep a lightweight spreadsheet with the comments that matter. Note whether readers asked for help, described a related problem, challenged the argument, or mentioned a buying need. This qualitative layer is where many useful posts outperform their visible reaction count.
The four KPIs I'd keep in view are:
- Comment quality: Are replies substantive and relevant?
- Save activity: Does the content have reference value?
- Profile-view movement: Did the post create curiosity about the author?
- Follower change: Did the topic attract the right audience?
Review the account weekly, then perform a deeper monthly comparison. Before changing your calendar, bookmark views for format performance, topic performance, audience response, profile visits, and clicks. People developing remote SMM skills and KPIs will recognize the broader lesson, reporting works when the metric connects to a decision.
Practical rule: Don't kill a format after one weak post. Change one variable, collect comparable examples, and then decide.
Your 14-Day Plan to Lift LinkedIn Post Engagement
Treat the next two weeks as a controlled test, not a frantic publishing challenge. Choose one audience, one business objective, and one primary engagement signal before you start.
Days one through three
Audit your recent posts. Sort them by native format, topic, opening style, and intended action. Identify the posts that produced meaningful comments, clicks, profile visits, or follows, not just the ones with the largest reaction count.
Pick one format to test. Native documents are a sensible starting point because the verified benchmark places them at 7.00% average engagement, but your own audience still gets the final vote.
Days four through seven
Publish a small comparison set. Keep the subject and objective similar while changing one element at a time, such as the first line, the document structure, or the closing prompt.
Log the result after the same review window. Don't change the format, topic, cadence, and CTA simultaneously. That creates activity, not learning.
Days eight through ten
Choose the stronger pattern and stop spending time on the weaker one. If documents attract saves and profile visits, make another document with a different topic. If text posts produce better qualified comments, refine the hook instead of abandoning text.
Keep the schedule sustainable. The cadence analysis cited earlier found that four to five weekly posts performed strongly, while eight or more weakened per-post results. Use that as a testing boundary, not a command to fill every available slot.
Days eleven through fourteen
Add one conversation mechanism. Tag one relevant collaborator, ask a narrow question, or publish a defensible point that invites informed disagreement. Then test a second native format, such as video or a multi-image post, without changing your measurement method.
For ongoing practice, a journal for practice owners can help you turn observations into repeatable publishing habits rather than isolated experiments.
At day fourteen, review:
- Keep: Formats and topics that attract the right actions.
- Kill: Posts that generate activity without relevance.
- Refine: Hooks that earn attention but fail to create conversation.
- Repeat: Tests with a clear winner and a useful next variation.
- Overhaul: A strategy that produces neither meaningful engagement nor business movement.
RedactAI helps you turn a topic into LinkedIn post drafts shaped around your profile, writing style, and publishing history, then refine, schedule, and review performance from the same workflow. Visit RedactAI to test a more deliberate way to create and improve your next fourteen days of LinkedIn content.