You've got a half-written post open on Tuesday, a client meeting in twenty minutes, and no idea whether you should post twice this week or five times. Last month you posted when you felt inspired. One post took off, two went nowhere, and you can't tell if the topic, format, or timing made the difference.
That's not a discipline problem. It's a missing system. A good LinkedIn posting strategy doesn't ask you to copy a big creator or post every day. It gives you defaults you can run this week, then a simple test to find what works for your account, your schedule, and your business goal.
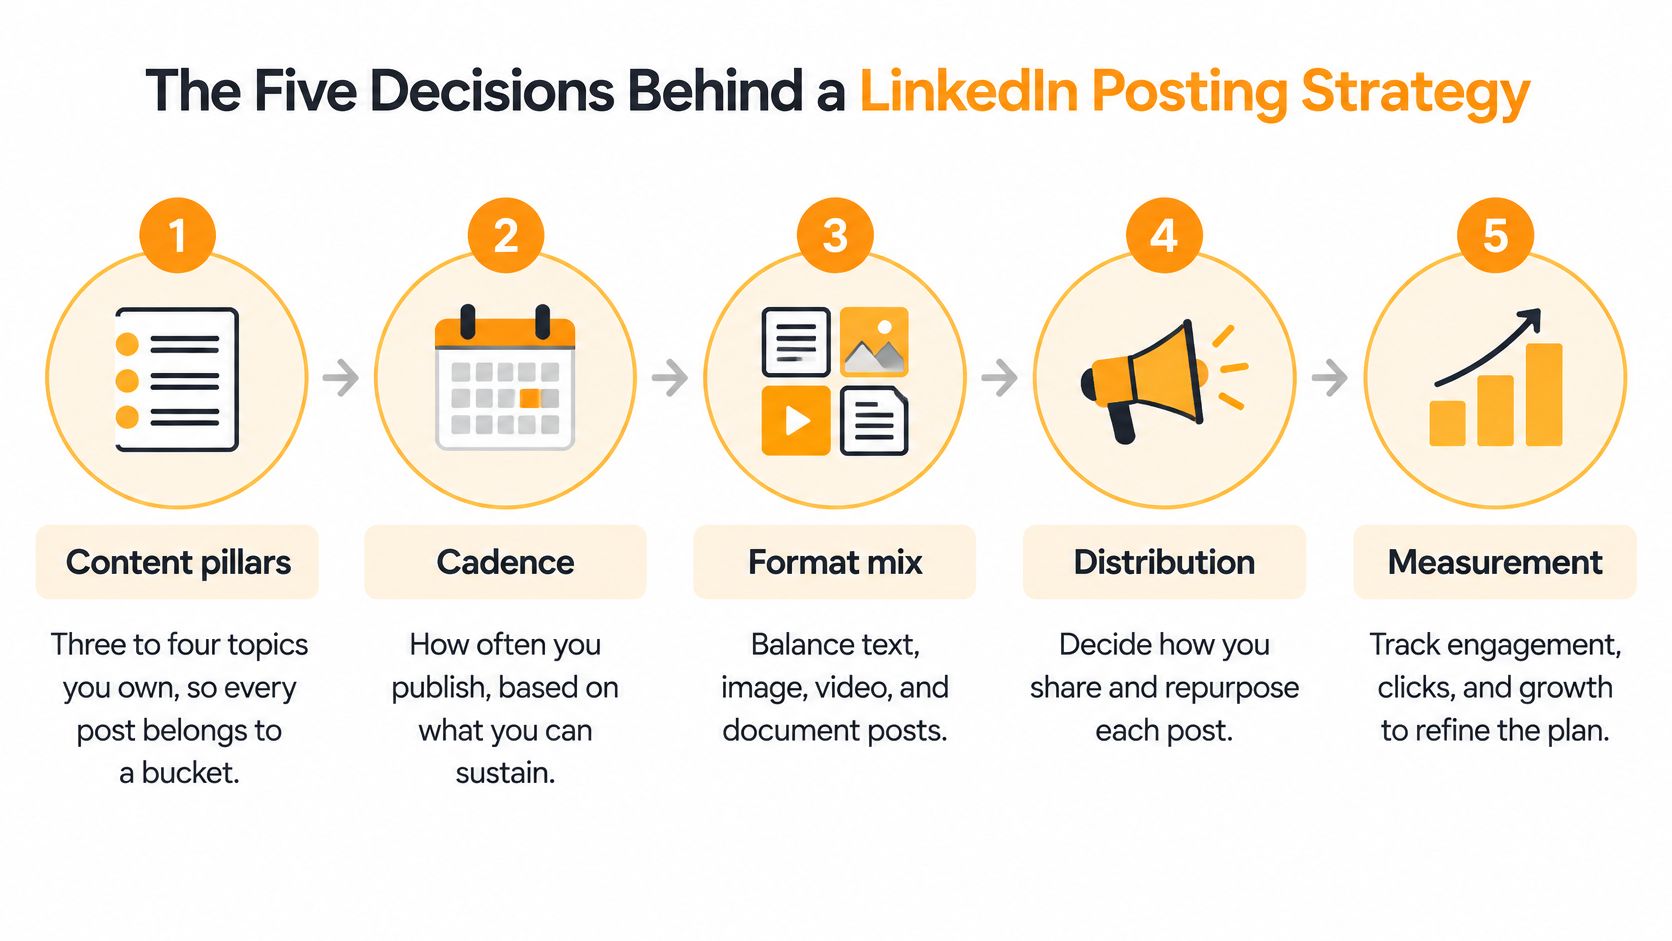
The Five Decisions Behind a LinkedIn Posting Strategy
Strip away the jargon and your strategy is five decisions, made in order.
- Content pillars: Pick three to four topics you own, so every post belongs to a bucket instead of starting from zero.
- Cadence: Choose how often you can publish without burnout. Start with two to three posts per week.
- Format mix: Decide which format carries each pillar. A workable default is one text post plus one document or image post weekly.
- Audience targeting: Name one primary segment, defined by seniority and industry, and write for that person for the next 90 days.
- Measurement: Judge posts by engagement rate by impressions plus qualified comments, compared against your own median.
| Decision | Question it answers | Starting default | Revisit when |
|---|---|---|---|
| Content pillars | Which topics do I own? | Three to four pillars | My goal or audience changes |
| Cadence | How often can I post without burnout? | Two to three posts per week | A four-week test shows a better fit |
| Format mix | Which format suits each pillar? | One text post plus one document or image post weekly | Format median shifts for two months |
| Audience targeting | Who should read and act? | One primary segment by seniority and industry | Leads or hires come from a new group |
| Measurement | What counts as working? | Engagement rate by impressions plus qualified comments | The business goal changes |
Don't copy volume from accounts playing a different game. Statista reported that, in 2025, LinkedIn accounts with more than 100,000 followers published an average of 43.48 posts per month, compared with approximately 0.98 posts per month for accounts with up to 1,000 followers. Most professionals sit closer to the small end, so big-account volume is a poor target.
If you want a second practical view on turning these choices into a weekly routine, SleekPost's LinkedIn posting action plan is a useful companion read. Treat every default above as a starting point to test, not a promise.
How to Build Your Content Pillars
Pillars stop the blank page problem. You don't invent them from ambition. You pull them from work you've already done and questions clients, candidates, or peers keep asking you.
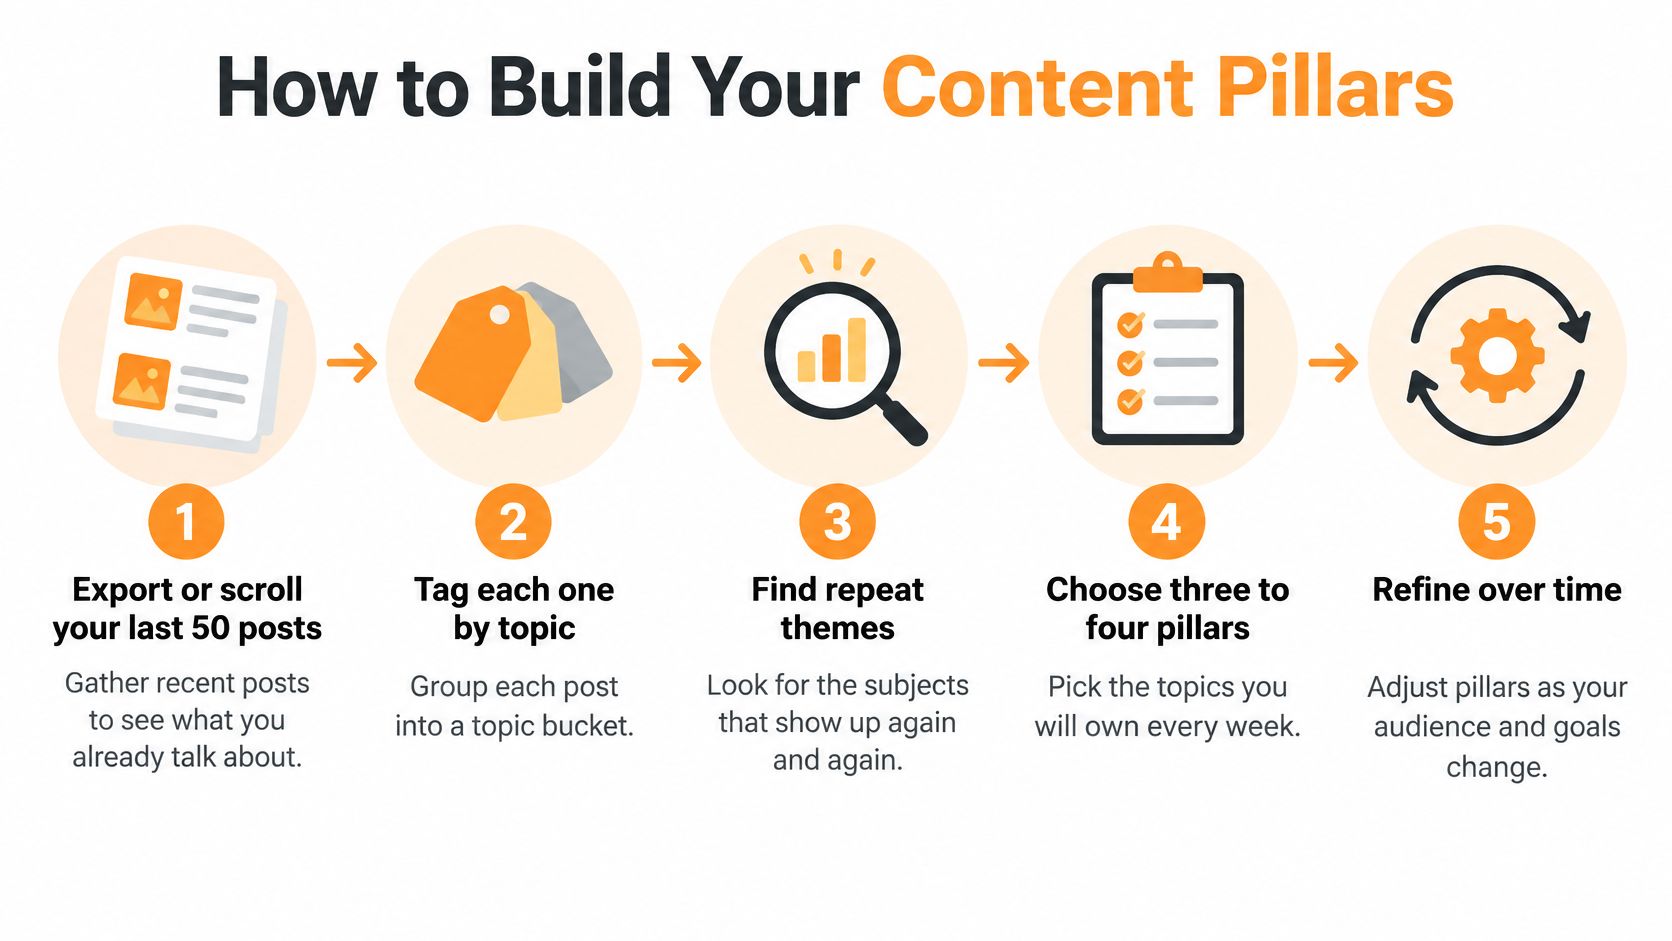
Six Steps to Pillars You Can Feed
- Export your history: Scroll through your last 50 posts and tag each one by topic. If you post rarely, tag emails, proposals, talks, and client answers instead.
- Name the outcome: Write what you want in the next six months, such as clients, candidates, a reputation in a niche, or a job move. A pillar that doesn't serve that outcome is a hobby, not strategy.
- Find the overlap: Keep topics where your experience meets questions your audience asks. Drop topics you like but can't prove, and topics you can prove but buyers never ask about.
- Weight the mix: Split effort on purpose, for example 40 percent practical how-tos, 30 percent case breakdowns, 20 percent industry takes and 10 percent personal stories. That ratio stops your feed turning into opinions only.
- Write one line per pillar: Name the reader and desired action, such as "Founders with cash flow stress who save this and book a call." If you can't name both, the pillar is too vague.
- Pressure test it: List ten post ideas for each pillar. If you stall at four, drop or merge it. You need depth before you need variety.
Say a fractional CFO starts with cash flow for founders, hiring finance staff, and a broad "finance tips" bucket. The first two produce ten ideas easily. The third produces three generic tips, so she merges it into case breakdowns and gets sharper posts.
This walkthrough shows the tagging and grouping process in practice.
Turn Pillars Into Drafts
Once pillars are fixed, label every draft with its pillar before you polish a word. That's how you spot drift early. If drafting is the bottleneck, RedactAI generates complete LinkedIn posts from just a few keywords, using your profile information, posting history, real-time industry insights and relevant online data. I'd still edit hard. Your specific numbers, decisions, and opinions are what separate a useful post from a smooth generic one.
Practical rule: If a draft doesn't fit a pillar, park it. Publishing off-pillar posts because they're timely is how positioning blurs.
How Often to Post Without Guessing
Frequency isn't a moral virtue. It's a production cost you pay every week, including replies and commenting, not just writing. Count the full cost before you commit.
| Cadence | Realistic for | Weekly time (estimate) | Main risk |
|---|---|---|---|
| One post per week | Part-time founders, new accounts | 1-2 hours | Too few posts to learn from |
| Two to three posts per week | Consultants, recruiters, most sales professionals | 3-5 hours | Quality slips by week six |
| Four to five posts per week | Full-time creators, agencies with a writer | 6-10 hours | Topic repetition and weaker angles |
| Daily | Only with a team or repurposed content | 10+ hours | Fatigue and diluted positioning |
Pick the lowest cadence you can keep for six weeks. A steady two posts beats an erratic five because you can learn from a steady run, and you won't resent the work by week three.
Read the Big Cadence Claims Carefully
You'll see confident numbers everywhere. Hootsuite's LinkedIn algorithm guide reflects the common guidance that consistent weekly posting tends to go with higher engagement, but read it as directional rather than a promised multiplier. The same caution applies to any cadence stat you find. People who post consistently often also write better, know their audience, and reply more, so frequency alone rarely explains the lift.
That's why cadence gets settled on your own account. For a consultant or founder, one extra post a week isn't free. It competes with delivery, sales calls, and thinking time. Judge it by marginal business value per post, not impressions alone.
The Drop-Back Rule
Compare each cadence against the inquiries, recruiter messages, and meaningful replies it produces. Move from two posts to four, give it four weeks, then look past surface engagement. If comments and conversations don't improve, the extra posts are vanity work.
If a higher cadence adds posts but no qualified replies after four weeks, drop back to the cadence before it.
More output can also blur your positioning. Thin angles get stretched, points repeat, and you start borrowing opinions you don't hold strongly. Your audience notices before your dashboard does. I'd rather see you protect one strong idea per week than water down five.
Which Formats Earn Engagement and Which Drive Clicks
Start with native documents if engagement is the goal, but don't treat a benchmark as a guarantee for your profile.

Social Insider's LinkedIn benchmarks, covering 2.45 million posts from 26,000 LinkedIn company pages, found average 2025 engagement rates of 7.00% for native document posts and 3.25% for link posts. Those are company-page numbers, so use them to rank likely options, then compare each format against your own median.
| Format | Avg engagement rate (2025) | Best use | Watch for |
|---|---|---|---|
| Native document | 7.00% | Frameworks, checklists, case breakdowns | Takes design time |
| Multi-image | 6.45% | Step sequences, before and after | Dense slides are hard to read on mobile |
| Video | 6.00% | Demos, quick explanations | Production time and watch time |
| Single image | 5.30% | Quotes, stats, announcements | Limited room for depth |
| Text only | 4.50% | Opinions, stories, quick takes | Easy to get lost in the feed |
| Poll | 4.20% | Audience research, opening a conversation | Little depth of insight |
| Link post | 3.25% | Driving traffic to a newsletter, article or offer | Lowest engagement; use it on purpose |
Give Each Format a Job
Documents suit educational frameworks, checklists, and case-study breakdowns because readers can swipe, pause, and save. Multi-image posts work for sequences and before-and-after proof. Video suits a demo or a tight explanation where seeing the process matters more than reading about it.
Text and single images carry opinions, stories, and announcements without production overhead. Polls help you research what your audience cares about, but they rarely prove expertise. Use them to open a topic, then follow with substance.
Link posts are different. Their job is conversion, not applause. Send readers to a newsletter, article, or offer only when the click is worth the likely engagement trade-off. The penalty isn't absolute, either. Net Influencer's report on Metricool's 2025 LinkedIn Study, covering 577,180 posts from 47,735 LinkedIn pages, found posts containing external links received 4.9% more impressions and 13.57% more interactions than posts without links. Context matters, so test instead of obeying folklore.
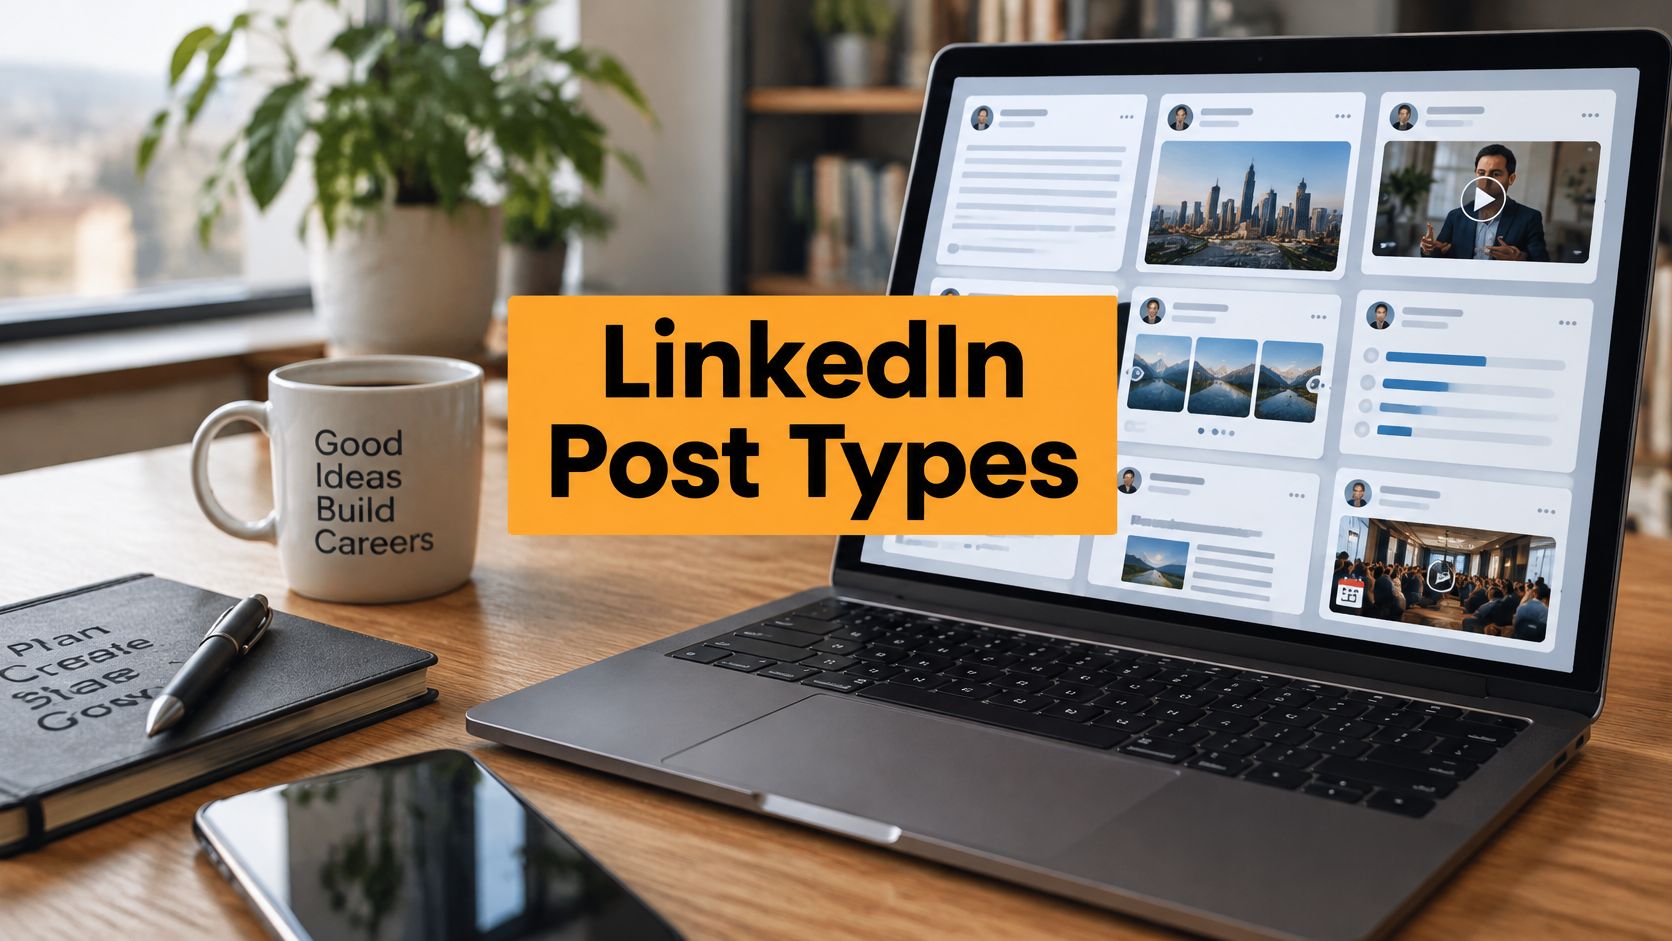
For a deeper comparison of jobs by format, see this guide to LinkedIn post types and when to use each one. Give each pillar one default format and one test format. Keep the format that beats your median across at least three comparable posts, recorded at the same time window. One lucky post proves very little.
Targeting the Audience Behind Each Goal
Can you name the job title of the person you want reading your next post? If you can't, you're probably writing for nobody in particular.
Audience targeting comes before wording. Define your primary segment through four lenses: seniority, geography, industry, and relationship stage. A senior operations director who already follows you needs a different angle from a stranger at the same title. One is ready for depth and proof. The other needs a clear problem and a reason to trust you.
| Primary goal | Target audience | Fit signal to watch | Post angle that fits |
|---|---|---|---|
| Hiring | Recruiters, hiring managers, senior candidates in one function | Saves and profile views from target titles | Team problems and what the role solves |
| Sales | Operators with budget in your niche | Direct messages and comments that name a problem | Client case breakdowns with real numbers |
| Reputation | Peers, industry editors, conference organizers | Shares and thoughtful comments from peers | Contrarian takes backed by experience |
| Career move | Executives and recruiters at target companies | Profile views from target company staff | Lessons from the role you want next |
One Segment for 90 Days
Pick one primary segment for the next 90 days and write to that person's problem in their language. A recruiter hiring engineers shouldn't use the same proof as a consultant selling to finance directors, even if both post about hiring. The first reader wants team pain and role clarity. The second wants cost, risk, and commercial impact.
This doesn't mean other people won't read you. They will. But mixed reach is useful only if your target reader is in the mix. After each post, check who commented and viewed your profile. If junior generalists respond while target buyers stay silent, don't automatically post more often. Change the angle first.
Audience check: Write the reader's title at the top of your draft. If the opening line wouldn't stop that person, rewrite it.
Segmentation also sharpens your calls to action. A hiring post can invite a candidate to compare their experience. A sales post can ask operators how they handle the same bottleneck. A reputation post can invite peers to disagree with evidence. For more on splitting readers by intent and stage, this breakdown of audience segmentation strategies goes further. I'd keep it simple at first. One segment, one problem, one clear next step beats five audiences and a vague "thoughts?" every time.
Metrics That Show Real Influence
Start with the one calculation that makes posts comparable: engagement rate by impressions = (reactions + comments + shares) / impressions × 100. It stops a widely shown post with weak response from looking better than a smaller post that moved the right people.
| Metric | How to calculate | What it tells you | Act when |
|---|---|---|---|
| Engagement rate by impressions | (reactions + comments + shares) / impressions × 100 | Response quality relative to reach | Two posts in a row below your eight-post median |
| Qualified comments | Comments from target titles or naming a problem | Interest from the right people | Comments are mostly generic praise |
| Profile visits from target segment | Analytics visits filtered by title or industry | Whether posts reach decision-makers | Visits rise but no messages follow |
| Impression reach | Raw impressions per post | Size of distribution | Reach rises while engagement falls |
| Downstream actions | Inquiries, meetings, signups, recruiter messages | Business value of the posts | No action after 30 days |
Compare Against Your Own Median
Take your last eight posts, calculate each rate, and find the median. That's your baseline. A post below it isn't automatically bad, and a post above it isn't automatically valuable. You still need to check who engaged and what happened next.
Reach and response can move in opposite directions. Sona's LinkedIn algorithm overview cites an analysis where impressions increased from 86,665 to 122,291 while median engagement rate slightly declined from 6.25% to 6.01%. It also notes recent reporting that video uploads and watch time each rose 36% year over year. Bigger distribution doesn't always mean stronger influence.
Read Attention Quality, Not Just Volume
A quieter post can win. Say a technical breakdown gets modest impressions but brings profile visits from senior buyers and two direct messages naming the exact problem. That's more valuable than a broad opinion post with reactions from people who will never buy, hire, or refer you.
Watch dwell and completion behavior where you can, especially saves, thoughtful comment threads, and profile visits after viewing. Segment results by seniority, industry, geography, and relationship stage. If senior practitioners engage, go more technical. If executives view but don't respond, make the business framing clearer and shorten the path to the point.
Set triggers before emotion gets involved. Change one variable after two consecutive posts below median, and review the whole approach after 30 days with no downstream action. If you need a simple reporting structure, this LinkedIn analytics report template can help you log the same fields every week. Consistency in measurement matters more than a fancy dashboard.
Run Your Four-Week Cadence Test
You now have defaults. Test one variable before you rebuild everything.
The Four-Week Procedure
- Hold two things constant: Pick one pillar and one format for the test posts. If topic and format change every time, cadence won't explain the results.
- Record your baseline: Calculate median engagement rate by impressions across your last eight posts using (reactions + comments + shares) / impressions × 100.
- Choose two cadences: Compare, for example, two posts a week against three posts a week. Keep posting times and calls to action broadly consistent.
- Batch and schedule: Write ahead so a busy week doesn't break the test. Scheduling, real-time statistics, and recycling proven posts make the run easier to maintain and review.
- Log at 72 hours: Record impressions, reactions, comments, shares, qualified comments, and profile visits for every post at the same point.
- Decide at week four: Compare each cadence's median with your baseline and with each other. Keep the stronger cadence and write down what you learned, including hours spent.
Fixes When Results Look Messy
If both cadences fall below baseline, check topic novelty and posting time before blaming frequency. A tired angle published more often is still a tired angle. If one post spikes, wait for three comparable posts before calling a winner. Novelty and distribution can flatter a single result.
Also check where successful posts send people. A strong post that leads to a vague headline, outdated experience section, or unclear offer wastes attention. Review your profile before the test starts, tighten the headline around your primary segment, and make the next step obvious. We offer a free AI LinkedIn Profile Review tool if you want a quick outside check.
Don't change cadence, format, and pillar in the same week. You'll get motion, not learning.
At the end of four weeks, you'll have something most posters never build: a cadence chosen from your own evidence, tied to time cost and business response. Run it for the next quarter, then test the next variable.
Ready to stop guessing what to post each week? RedactAI helps you generate complete posts in your voice, schedule them around your chosen cadence, review real-time statistics, and recycle your best content, so you can run your tests without spending hours at a blank page. Visit RedactAI, set up your pillars, and publish your first four-week test with a system you can sustain.