Ever feel like you're just creating content and tossing it into the void? You hit "publish," watch the page views tick up, and then... nothing. You have no real clue if that piece actually did anything for your business. If that sounds familiar, you're not alone.
This guide is about cutting through that chaos. We're going to ditch the confusing jargon and build a simple, straightforward way to see what's really working, what’s falling flat, and how to use that data to make everything you create even better.
Moving Beyond Page Views and Vanity Metrics
Let's get one thing straight: effective content measurement is not about chasing "vanity metrics." These are the flashy numbers that look great in a report but don't actually tell you if you're any closer to hitting your business goals.
Ditching the Vanity Metrics
So what exactly are these so-called vanity metrics? They're the surface-level stats that are super easy to track but offer almost zero strategic insight. I'm talking about things like:
- Page Views: Sure, a lot of people saw your page. But were they the right people? Did they find it useful? High traffic doesn't automatically mean high value.
- Social Likes: A "like" is nice, but it's a low-effort tap on a screen. It almost never signals that someone is ready to become a customer.
- Impressions: This just tells you how many times your content appeared on a screen. It doesn't mean anyone actually paid attention to it. For a deeper dive on this, especially on professional networks, check out our guide on what are impressions on LinkedIn.
Relying on these numbers gives you a false sense of security. It can make you think a campaign is a huge success when, in reality, it’s not driving any meaningful action at all.
The real secret to measuring content performance is changing the question you ask. Stop asking, "How many people saw this?" and start asking, "What did the right people do after they saw this?"
Focusing on Actionable Insights
Instead, we need to focus on metrics that show real user engagement and connect directly to your bottom line. The goal is to find the story hidden in the numbers.
For example, you might have one blog post with fewer views but a 25% higher conversion rate on its call-to-action. That post is infinitely more valuable than a high-traffic article that brings in zero leads. It's doing the heavy lifting for your business.
This kind of thinking requires tying your content directly to your business objectives. It's a universal principle, whether you're selling software or developing employee skills. In fact, a similar shift is happening in education, where experts are learning how to measure content performance in corporate training by looking past simple completion rates.
When you focus on metrics that matter—like qualified leads, demo requests, or actual sales—you can finally prove the ROI of your content. This is what empowers you to make smarter decisions, fine-tune your strategy, and create content that truly delivers.
So let's start by figuring out what success actually looks like for you.
Tying Your Content Goals to Real Business Objectives
Before you even glance at a dashboard or track a single metric, you have to ask yourself one crucial question: Why? Seriously, why are you creating this content in the first place? If you can't answer that, you're just making noise and hoping for the best.
The secret to measuring content performance effectively is to start by linking every single piece you create back to a core business objective. This isn't just a "nice-to-have" step; it's the foundation of everything. It’s how you make sure you’re measuring what actually moves the needle, not just what's easy to count.

What's Your Content's Mission?
Think of your business goals as the destination and your content as the car that gets you there. You wouldn't take a sports car on an off-road adventure, right? Different goals need different content strategies.
Are you trying to build brand awareness? Generate qualified leads? Or drive direct sales? Each of these missions demands a completely different way of measuring success.
For example, a B2B SaaS company that wants more qualified leads should be obsessed with demo requests from their blog posts, not just page views. The job of their content is to attract the right people and nudge them toward that specific action.
On the other hand, an e-commerce brand launching a new sneaker line might be all about awareness. For them, success looks like a ton of social shares, a wide reach, and lots of clicks to the new product pages from their articles. The goal is to create buzz, not necessarily to close a sale on the first touch.
Here’s a little secret: the best content strategies are built on a simple idea. Content is a tool designed to achieve a specific business outcome. Your measurement plan is just the instruction manual for that tool.
Matching Content Types to Your Goals
Once you know your main objective, you can start being strategic about the types of content you create. Not every blog post has the same job. You can level up your https://redactai.io/blog/content-creation by giving each piece a clear purpose from the get-go.
Let's look at a few common scenarios I've seen play out:
Goal: Brand Awareness
- Your Go-To Content: Top-of-funnel blog posts that answer broad questions, slick infographics, and fun social media videos.
- What to Watch: Social shares, impressions, traffic from new visitors, and brand mentions.
Goal: Lead Generation
- Your Go-To Content: Gated eBooks, in-depth webinars, detailed case studies, and articles with strong calls-to-action (CTAs).
- What to Watch: Form completions, the number of Marketing Qualified Leads (MQLs), and new newsletter sign-ups.
Goal: Driving Sales
- Your Go-To Content: Product comparison guides, customer success stories, and bottom-of-funnel articles that seal the deal.
- What to Watch: Demo requests, direct sales conversions, and your Customer Acquisition Cost (CAC).
When you align things this way, measurement becomes so much simpler. You know exactly what success looks like for every piece of content because you defined its job before you ever hit "publish."
It's All About the Revenue Now
This direct line between content and business outcomes isn't just a good idea—it's quickly becoming the industry standard. While 53% of marketers are still tracking things like social media engagement, there’s a massive shift underway.
Today, 41% of marketers are measuring their content's success based on actual sales. They're using CRM data to connect the dots directly from a blog post to a closed deal.
This trend tells us one thing loud and clear: leadership wants to see a tangible return on investment. By connecting your content to real business goals, you stop talking about vanity metrics and start demonstrating real, bottom-line value.
Choosing the Right KPIs for Your Content
Let's be honest: not all content is created equal. A deep-dive blog post has a completely different job than a quick Instagram Reel, and your measurement strategy needs to reflect that. Picking the right Key Performance Indicators (KPIs) isn't about hoarding every scrap of data you can find. It's about zeroing in on the few metrics that actually tell you if a piece of content is doing its job.
The way you measure performance is going to change depending on where the content lives. We generally see content fall into three main buckets: website content (like blogs and landing pages), social media content, and specific marketing assets (like emails). To get a clear picture of what's working, you have to pick the right KPIs for each one.
Matching Metrics to Your Content Format
Time to get practical. If you've poured your heart into a 2,000-word article, metrics like Time on Page and Scroll Depth are your best friends. They're the closest you can get to knowing if people are actually reading it. A high time on page is a fantastic sign that your content is valuable and holding people's attention—a huge win.
But for a social media post? Those same metrics are useless. Instead, you need to be looking at things like:
- Shares: This is the ultimate compliment. Someone liked your content so much they were willing to put their name on it and show it to their friends.
- Comments: This signals real-time conversation and engagement, which is the whole point of social media.
- Saves: On platforms like Instagram or Pinterest, a "save" is a powerful indicator that your content is so useful people want to come back to it later.
This visual gives a great overview of how you can pull audience insights together from different places to get the full story.
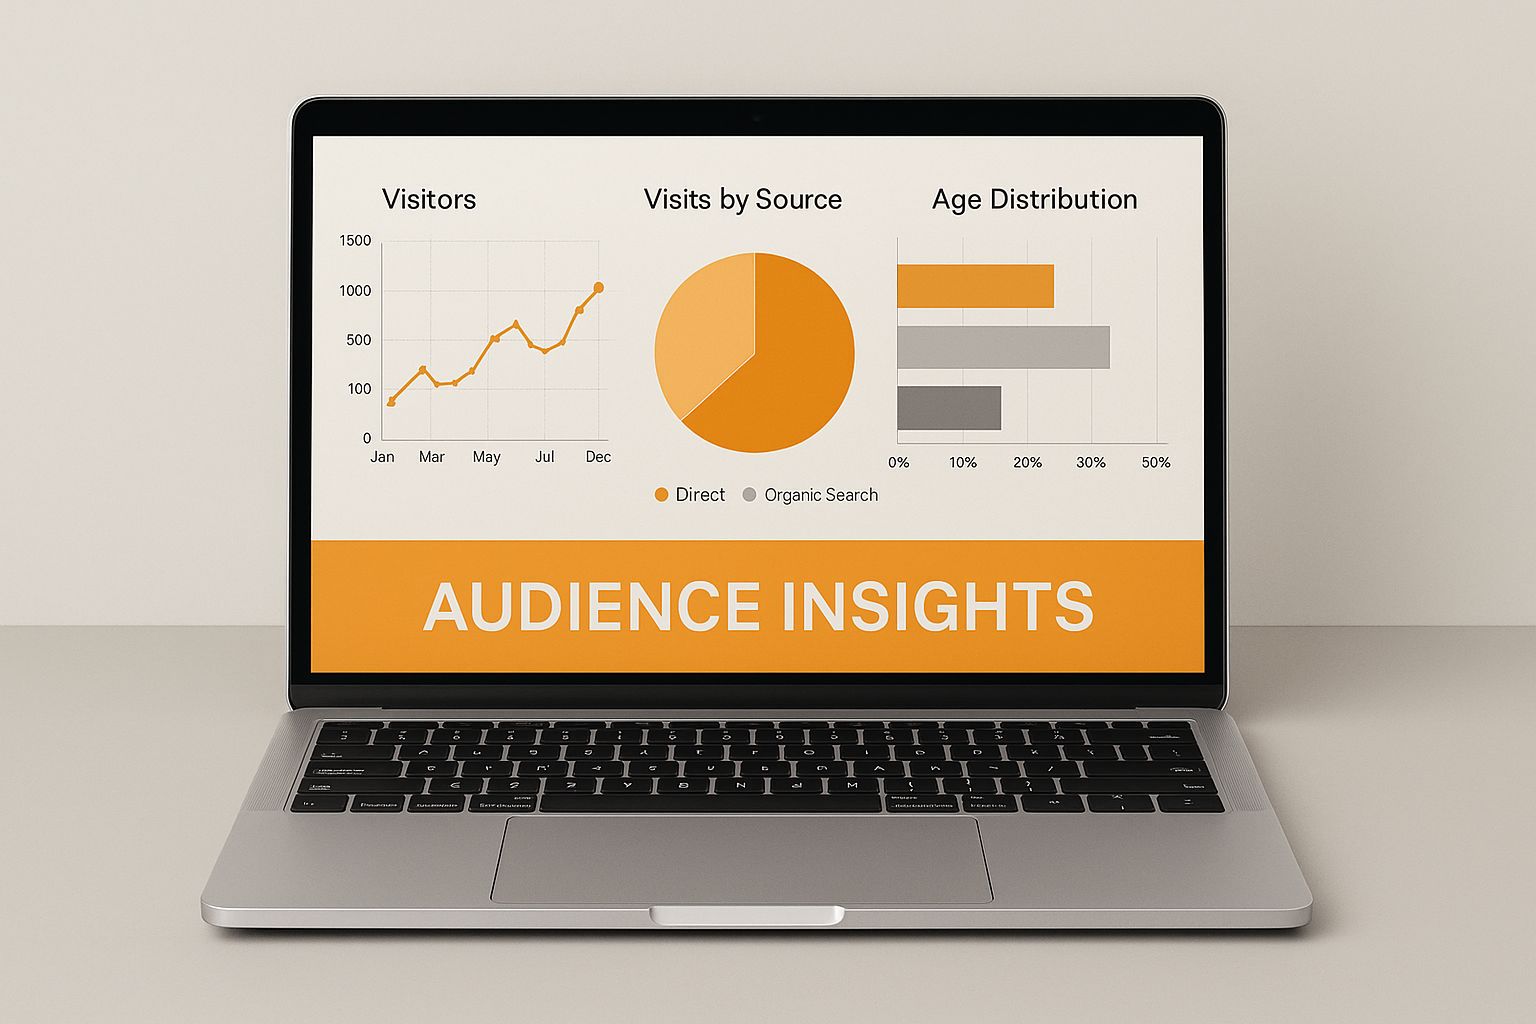
As you can see, tracking where your traffic is coming from and what people do once they get to your site is critical for understanding your audience.
A Quick Guide: Matching Content to KPIs
To make this even easier, I've put together a quick reference table. Think of it as a cheat sheet for pairing your content with the right metrics so you're always tracking what matters most.
| Content Type | Primary KPIs | Secondary KPIs |
|---|---|---|
| Blog Posts / Articles | Time on Page, Scroll Depth, Organic Traffic | Bounce Rate, New vs. Returning Users, Social Shares |
| Landing Pages | Conversion Rate, Form Submissions | Traffic Sources, Cost Per Conversion (CPC) |
| Email Newsletters | Click-Through Rate (CTR), Open Rate | Unsubscribe Rate, Conversion Rate (from clicks) |
| Social Media Posts | Engagement Rate (Likes, Comments, Shares) | Reach, Impressions, Saves |
| Video Content | Watch Time, Audience Retention | Views, Click-Through Rate (on CTAs), Likes/Dislikes |
This isn't an exhaustive list, but it's a solid starting point that covers the most common content formats. Use it to guide your initial setup and then refine it as you learn more about what drives results for your specific audience.
Measuring Campaign-Specific Content
The rules of the game change again when you're looking at content created for a specific campaign, like an email promoting a sale or a landing page for a new download. Here, the focus gets razor-sharp and dials in on direct action.
The most successful marketers I know are ruthless about tracking campaign-specific KPIs. They understand that for a landing page, a high view count means nothing if the conversion rate is zero.
Think about an email newsletter you sent to promote a webinar. The single most important KPI is the Click-Through Rate (CTR) on that registration link. It tells you exactly how effective your copy and call-to-action were. In the same way, if you have a landing page offering a downloadable eBook, the main thing you care about is the Conversion Rate—what percentage of visitors actually filled out the form and downloaded it?
As you dig in, it helps to look at broader lists of 10 key website metrics to track that can add more context to your analysis. By carefully aligning your KPIs with your content's format and goal, you stop guessing and start making smart, data-driven decisions that actually move the needle.
Building Your Content Analytics Toolkit
Knowing what to measure is a great first step, but you also need the right tools to actually gather that data without losing your mind in a sea of spreadsheets. Building a solid analytics toolkit isn't about collecting dozens of platforms; it’s about picking a few powerful ones that give you a complete picture of how your content is performing from start to finish.
The real goal here is efficiency. You want to track the right things, not everything. A well-chosen set of tools means you'll spend less time pulling reports and more time figuring out what to do with the insights you’ve uncovered.
The Foundational Tools Everyone Needs
Every content creator needs a couple of core tools to get started. Think of these as the non-negotiables that will give you a baseline for all your measurement efforts.
Google Analytics 4 (GA4): This is mission control for your website content. The beauty of GA4 is that it's built around events, not just simple page views. This lets you track actions that actually matter to your business, like how many people click your "Request a Demo" button or download a whitepaper.
Platform-Specific Analytics: Your content lives all over the web, so you have to go where the data is. That means digging into the native analytics on each platform, like Meta Business Suite for Facebook and Instagram or LinkedIn Analytics for your professional content.
When it comes to LinkedIn, those engagement metrics are gold. If you're trying to stay consistent, you might even look for ways to automate LinkedIn posts to keep fresh content flowing while you analyze what's working. These built-in tools often have audience demographic data you simply can’t find anywhere else.
Leveling Up Your Analytics Stack
Once you've got the basics down, you can bring in some more specialized tools to get deeper insights into user behavior and your organic search performance. These are the tools that help you answer the "why" behind the numbers.
Your basic analytics tell you what happened. Advanced tools help you understand why it happened. Seeing that a user left your page is one thing; seeing a recording of them rage-clicking a broken button is an actionable insight.
Consider adding a user behavior tool like Hotjar or Crazy Egg. These platforms are fantastic because they provide heatmaps, session recordings, and on-page surveys that show you exactly how people are interacting with your content. You can literally watch where users click, see how far they scroll, and pinpoint where they get frustrated and leave.
For anyone serious about organic growth, an SEO tool is a must-have. Platforms like Ahrefs or Semrush do more than just track keyword rankings. They reveal which articles are earning valuable backlinks, which pages bring in the most organic traffic, and where you have opportunities to beat your competitors. When you combine that SEO data with your website analytics, you get a complete story of your content's impact—from the moment someone sees you in a search result to the moment they convert.
Turning Your Data into Actionable Insights

Collecting data is easy. The real skill is turning those numbers into a story that tells you exactly what to do next. Let's be honest, data is just noise until you give it some context. This is where we stop just looking at charts and start asking why.
Here’s a classic puzzle I see all the time: an article gets an incredible time on page, but zero conversions. What gives?
A high time on page is a great sign—it means your content is genuinely engaging. But the lack of conversions points to a breakdown somewhere else, usually with your call-to-action (CTA). Maybe it wasn't clear, compelling, or even visible enough. This is the heart of measuring content performance: you connect the dots between different data points to figure out what's working and what’s not.
Spotting Trends and Connecting the Dots
Your analytics dashboard is basically a treasure map full of clues. The trick is to look for patterns and relationships between different metrics instead of analyzing them in a vacuum. You need to see how they play off each other.
Let’s say you launch a new blog post and push it out on LinkedIn and Twitter. After a week, you dive into the numbers and see:
- LinkedIn traffic has a high average time on page, a bunch of comments, and even a few clicks over to your pricing page.
- Twitter traffic, on the other hand, has a much higher bounce rate and practically no on-site engagement.
The insight here isn't that your content failed. It’s that you’ve found your sweet spot. The content clearly hits home with the professional crowd on LinkedIn but isn't landing with the fast-scrolling audience on Twitter. Now you know where to double down on your promotion efforts.
The point of all this analysis isn't to find a single "winning" metric. It's to understand the story your data is telling you about what your audience actually wants and how they behave.
This way of thinking is only getting more important. Heading into 2025, we've moved past just counting page views. The focus is now on metrics that show real, meaningful engagement. One that's gaining a lot of traction is 'Engaged Sessions,' which filters out the fly-by visits by only counting sessions that last over 10 seconds and include some kind of user interaction. It's a much better signal of genuine interest. You can find more on these essential metrics over on project-aeon.com.
From Insights to Concrete Actions
Okay, so you've spotted a trend or a problem. Now what? You form a hypothesis and start testing. This is how you move from just collecting data to actively optimizing your strategy.
Let's circle back to that high-engagement, low-conversion article. Your hypothesis might be: "The CTA at the bottom of the page is too subtle and gets lost."
Now, you build a simple action plan:
- Tweak It: Change the CTA button color to something that pops and rewrite the copy to be more direct and urgent.
- Test It: Run the new version for two weeks and compare its conversion rate to the original's baseline.
- Analyze It: Did the change actually move the needle? If it did, you've just found a tactic you can roll out across your other high-traffic posts.
This simple loop—analyze, hypothesize, test, and repeat—is the engine that drives content improvement. It turns your analytics from a backward-looking report card into a forward-looking roadmap for creating content that actually performs.
Got Questions? Let's Talk Content Performance
Alright, so you've got a plan and you're ready to dive into the data. But even the best-laid plans come with a few head-scratchers. Let's tackle some of the most common questions that pop up when you start measuring how your content is really doing.
How Often Should I Actually Look at My Metrics?
This is a big one, and the honest answer is... it depends on what you're looking for.
For the big-picture stuff—like your overall organic traffic, how many leads you're generating, and the ROI of your content—a monthly review is usually perfect. This gives you enough time to see real trends emerge without getting bogged down by the daily ups and downs.
Now, if you're in the middle of a specific campaign or trying out a new video format, you'll want to tighten that up to a weekly check-in. This lets you stay nimble and make adjustments on the fly if things aren't hitting the mark.
My two cents? Steer clear of checking your stats every single day. The data naturally fluctuates, and obsessing over it can lead you to make knee-jerk decisions that derail your long-term strategy.
What’s a "Good" Bounce Rate for a Blog Post, Anyway?
This question trips a lot of people up because there's no single magic number. Bounce rates can swing wildly depending on your industry, the type of content, and where your traffic is coming from.
As a general benchmark, a bounce rate between 60-90% for a blog post is pretty normal. A high bounce rate doesn't automatically mean your content is failing.
Think of it this way: someone searches for a specific answer, lands on your article, gets exactly what they need in the first paragraph, and leaves. They're happy, and your content did its job perfectly. That's a "good" bounce. The key is to look at bounce rate alongside other metrics like Time on Page to understand the full story.
How Do I Actually Measure the ROI of My Content?
Calculating the Return on Investment (ROI) for content marketing can feel a bit fuzzy, but the core idea is simple. You're just comparing what you spent to create the content against the money it brought in.
The basic formula is: (Revenue - Cost) / Cost.
The real challenge is connecting the dots from a piece of content to actual revenue. This is where a solid attribution model in your analytics platform becomes crucial. You need a system that can track a customer's journey, linking the blog posts they read or the videos they watched to the final sale. This often means integrating your analytics with a CRM to finally see how that article view turned into a signed deal.
Ready to create LinkedIn content that consistently performs? RedactAI uses your unique voice to generate engaging posts, helping you build your personal brand without the writer's block. Join over 21,000 creators and start for free.


