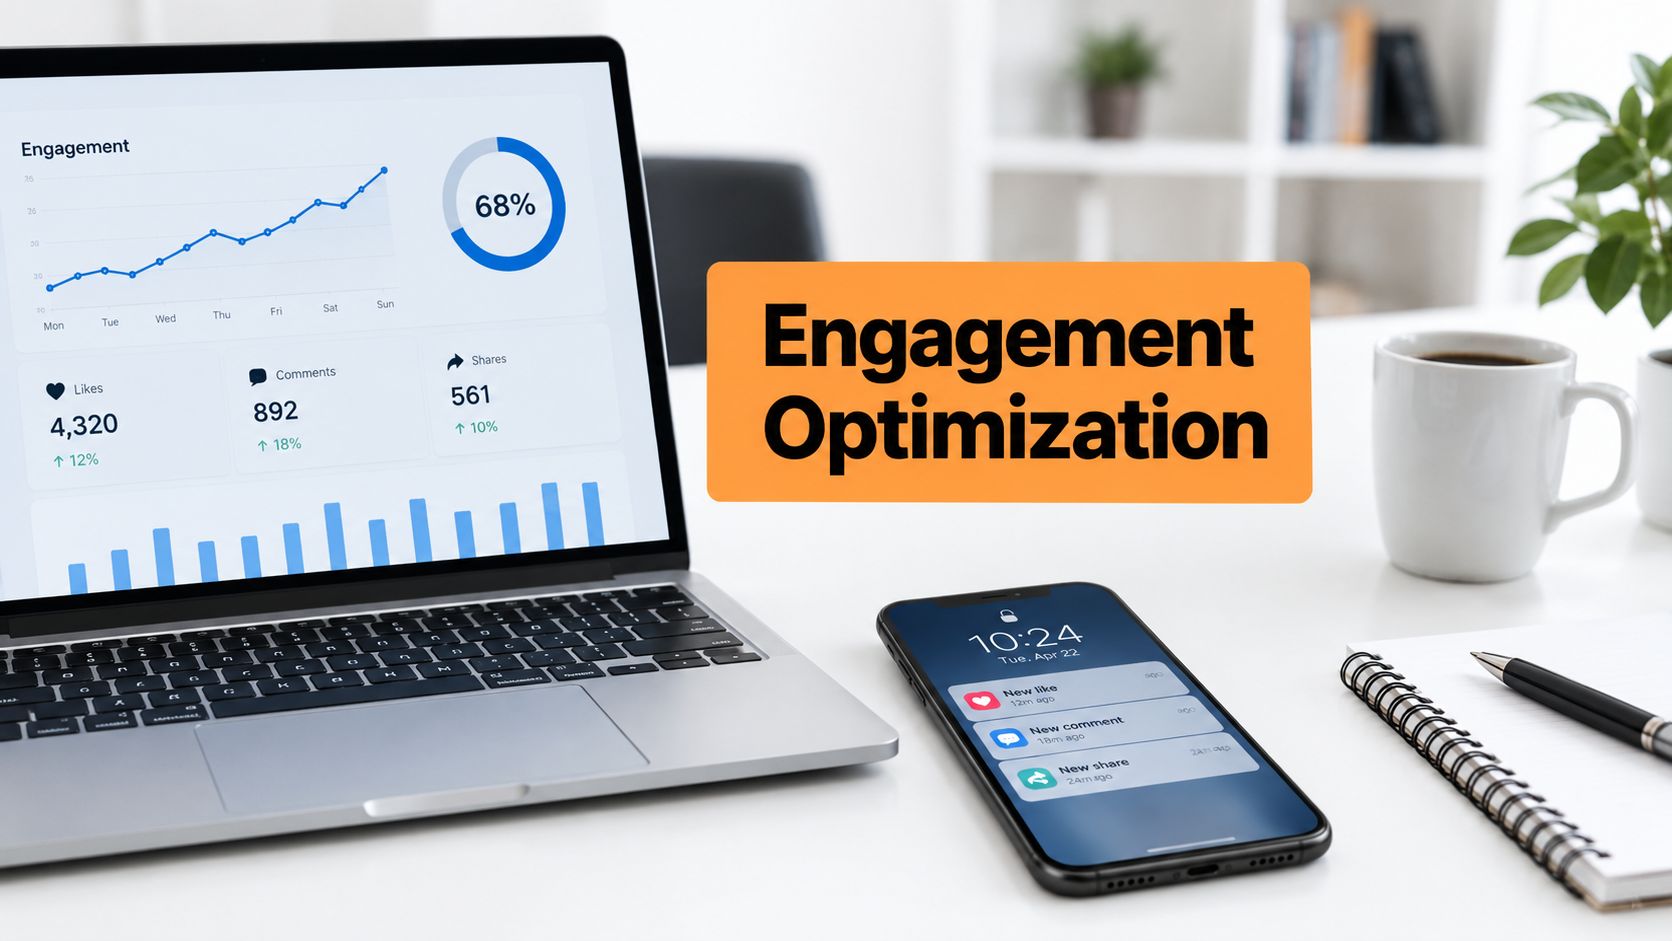
LinkedIn analytics should be interpreted as a measurement funnel, not a single popularity score. A reported overall engagement benchmark of 5.2% can provide context, but it doesn't tell you whether the right people saw your post or took a meaningful action. Taplio's benchmark discussion also notes that professional-services and B2B-technology results can be materially lower, which makes universal targets a poor basis for strategy.
The serious question isn't “How many impressions did I get?” It's “Where did attention come from, how did people respond, and did the post create a useful professional outcome?” Impressions measure distribution. Engagement measures response. Profile visits, relevant audience signals, conversations, subscriptions, applications, and opportunities show whether that response had value.
Rethinking LinkedIn Analytics as a Funnel
A post can look healthy at the top of the dashboard and still fail where it counts. High impressions only mean LinkedIn displayed it often. They do not prove people read it, remembered it, visited your profile, or started a real business conversation. Chasing one number as a verdict is how professionals end up optimizing for noise.
Use a funnel instead:
- Impressions: estimated appearances in feeds.
- Engagement: reactions, comments, clicks, saves, sends, and reposts, depending on the analytics view.
- Profile visits: people curious enough to check who you are.
- Leads and conversions: meaningful conversations, subscriptions, applications, hires, or deals.
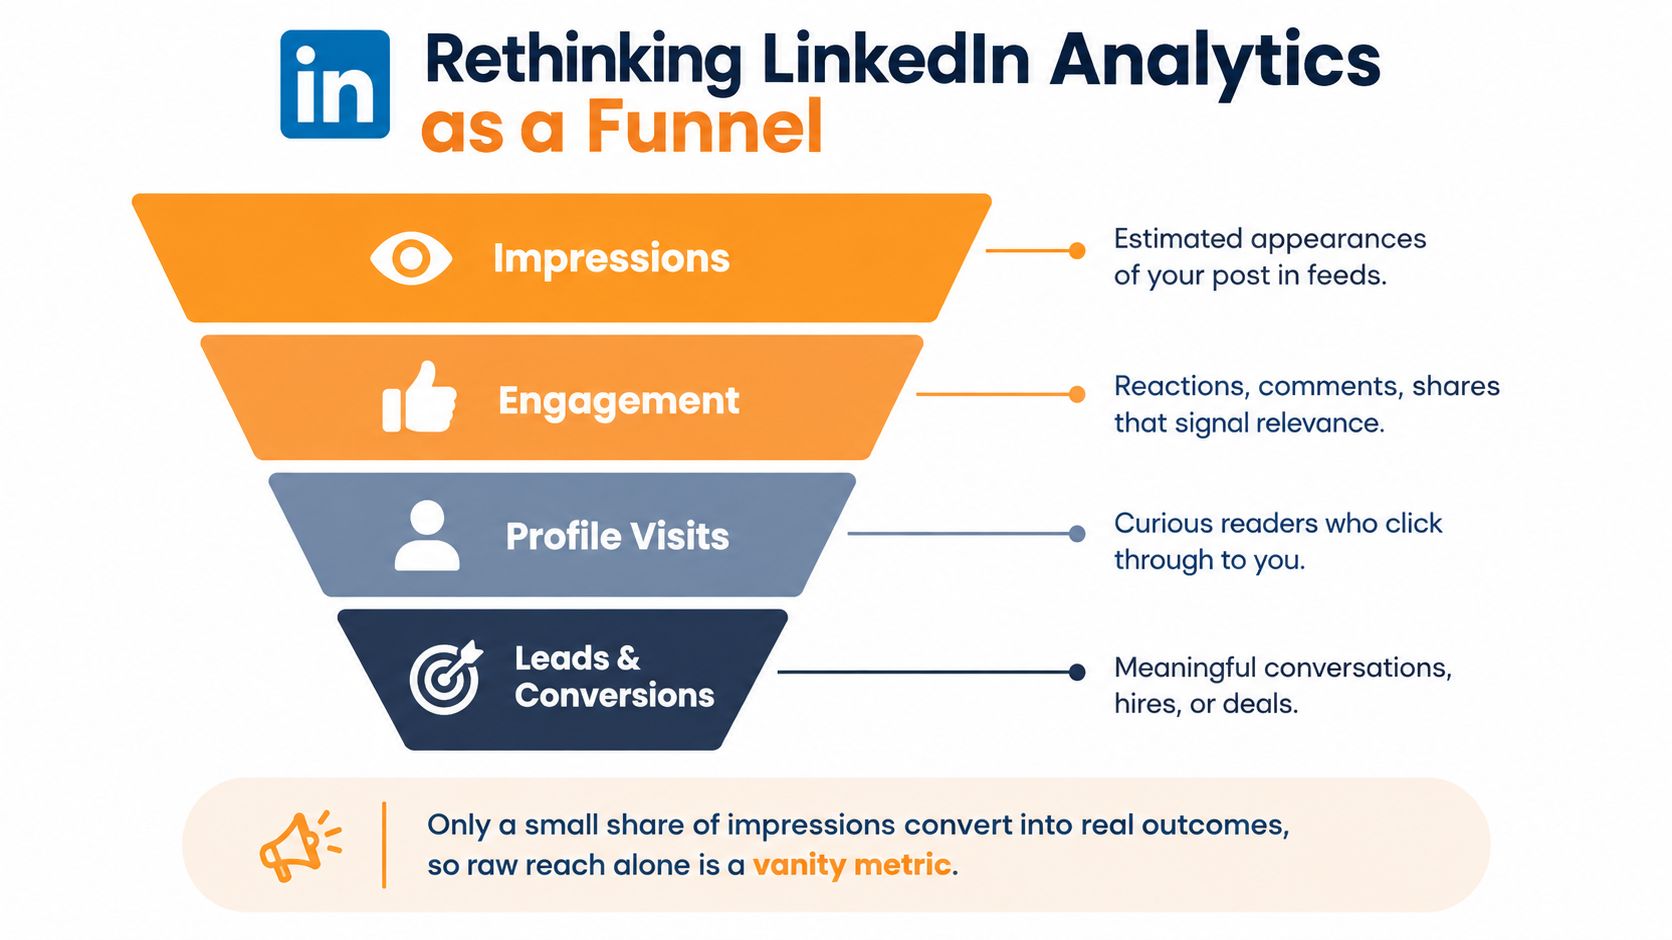
LinkedIn defines impressions as an estimate and engagement rate as interactions divided by impressions. That practical split matters. A post can rack up impressions and still earn a weak response, while a smaller post can produce a stronger rate. The point is not visibility for its own sake, it is progression from exposure to action.
Strategic rule: Do not ask whether a post “performed.” Ask which stage of the funnel worked and where value dropped out.
That lens changes the review process. High reach with low response usually means the message is too broad, too vague, or aimed at the wrong audience. Low reach with high response usually means the positioning is solid, but distribution is weak. A post that drives profile visits from relevant decision-makers is more useful than one that attracts a large passive audience.
If you want a practical way to inspect content performance and turn raw activity into decisions, see analytics features. The habit matters more than the tool. Review patterns across posts, not isolated spikes.
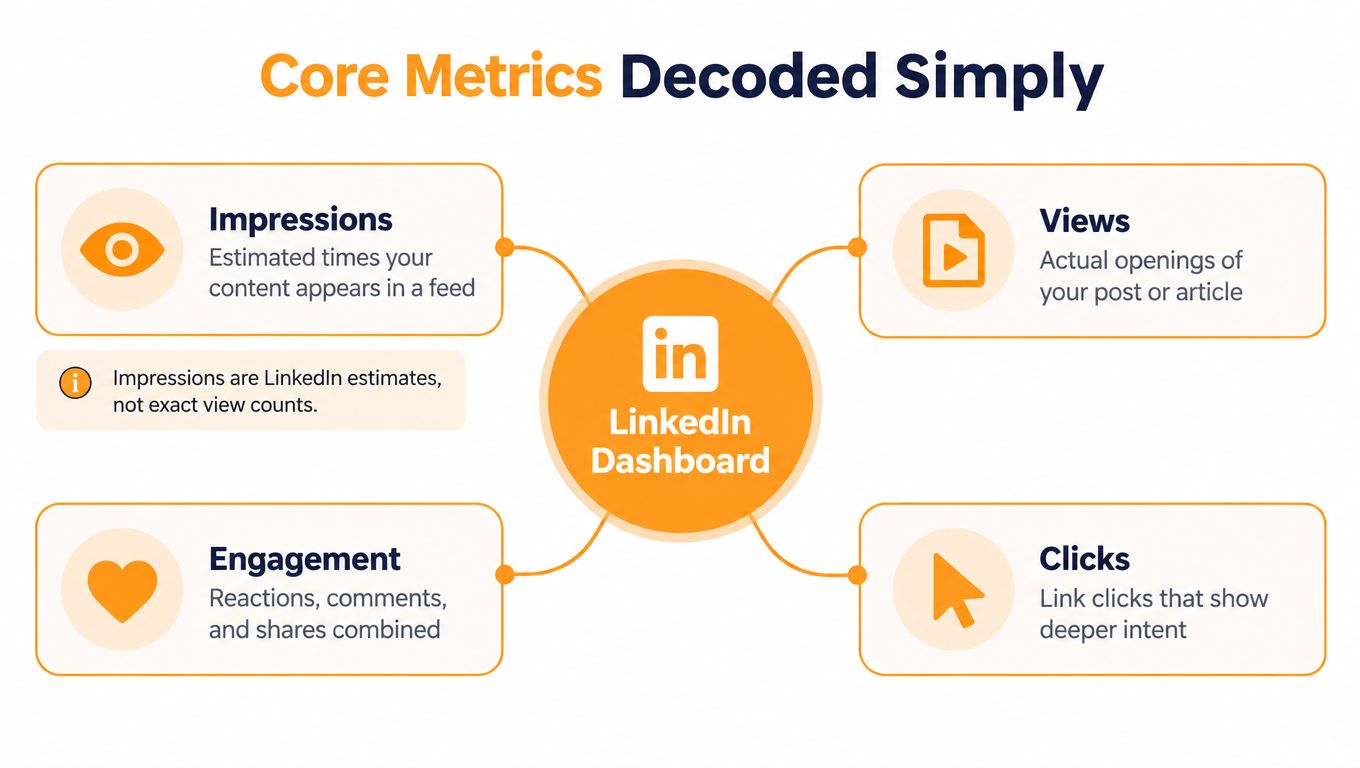
Core Metrics Decoded Simply
LinkedIn dashboards mix three different signals: estimated distribution, unique audience, and action quality. Stop reading them as one blob.
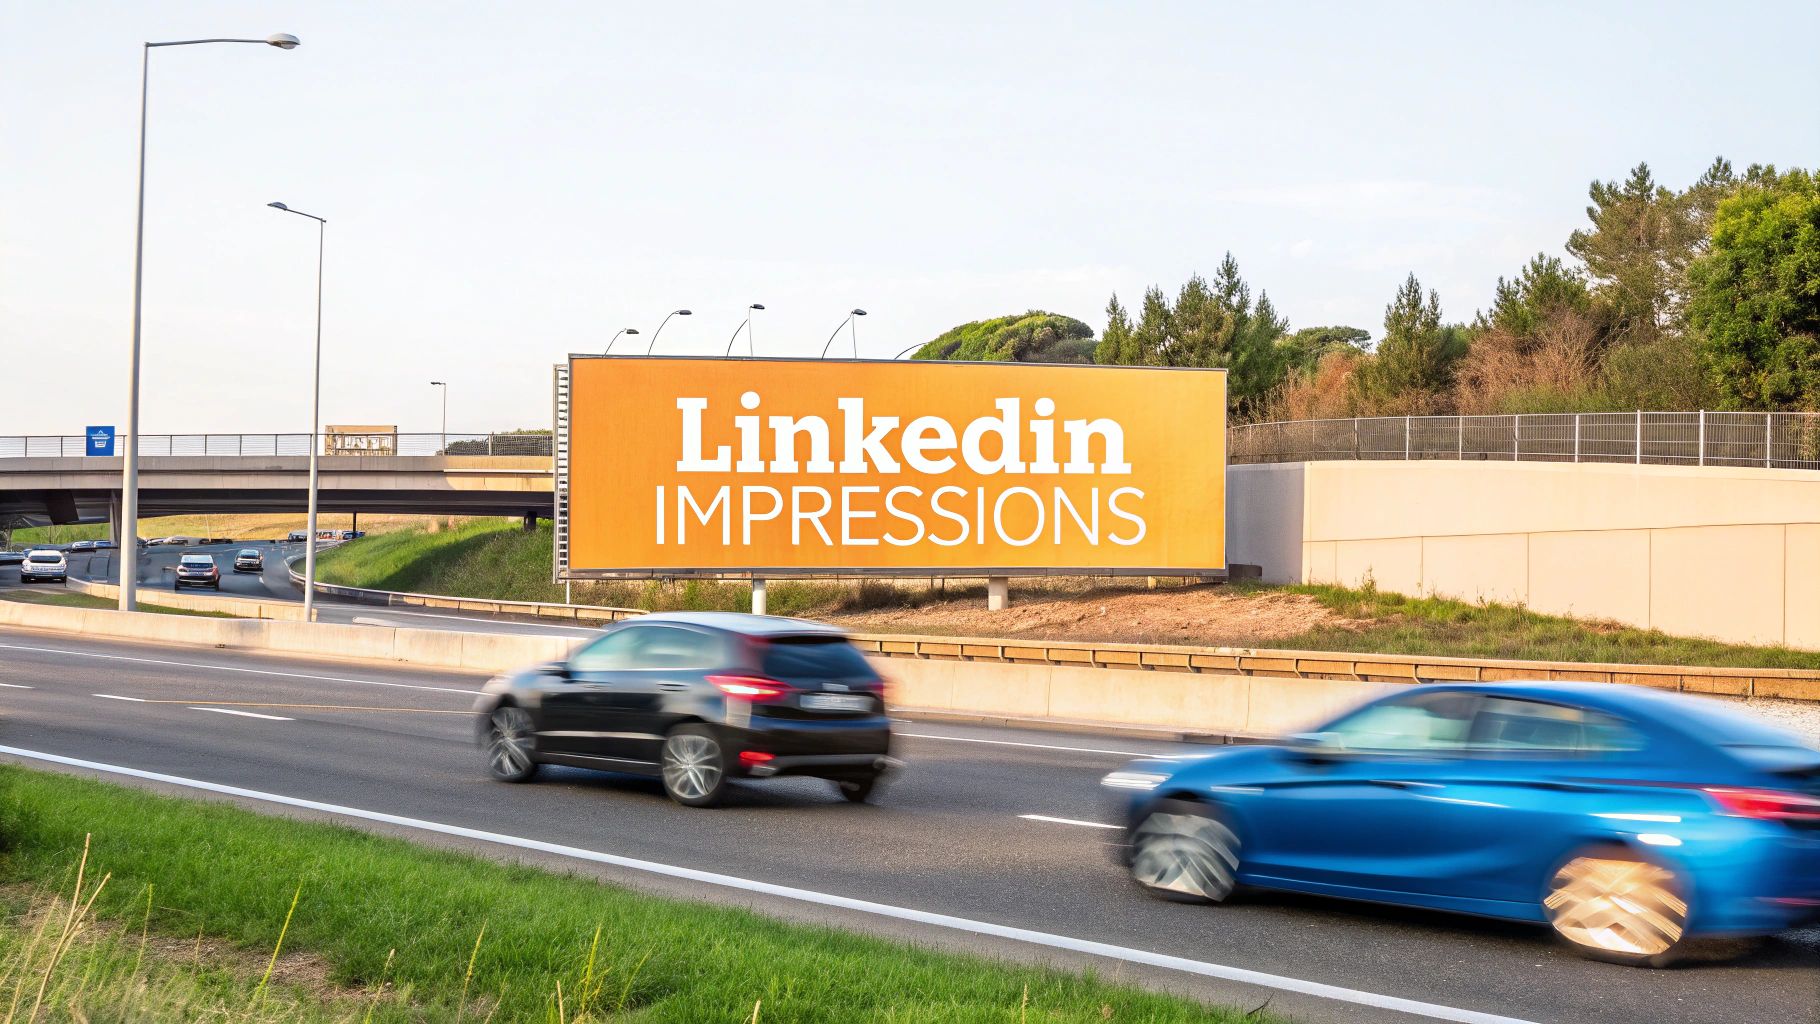
Impressions are appearances, not readers
Impressions count how often LinkedIn estimates your post was displayed. One member can generate several impressions, so this is a delivery measure, not a unique-person count.
That matters because impressions can look healthy while the audience stays passive. A post may circulate repeatedly and still fail to move anyone. LinkedIn's official explanation of post analytics defines impressions as estimated displays.
Members reached is the unique-audience number. Use it to judge breadth. Use impressions to judge total distribution volume. If impressions are much higher than reach, the post is getting repeat exposure from the same people.
That split is useful when you compare content types. A post with modest reach and strong follow-up action can be more valuable than a broad post that only creates noise.
Engagement rate shows the quality of response
Engagement rate is interactions divided by impressions. That sounds simple, but the mix behind the number matters more than the number itself. Interactions include clicks, reactions, comments, and shares.
Treat those actions differently. Reactions usually show light approval. Comments signal active interest. Shares and sends mean the post was useful enough to pass on. Clicks show curiosity, but you still need to know what was clicked and whether the visitor fit the target audience.
The fastest way to misread a post is to stop at the rate. A high engagement rate driven by low-value clicks is not the same as a post that earns serious comments from the right people.
For a plain-language breakdown of how the interaction mix affects interpretation, try Narrareach for LinkedIn. If your dashboard mixes the terms loosely, LinkedIn impressions versus views helps separate the labels before you compare results.
Do not compare posts, pages, or reports until the metric definitions match. If one report uses impressions and another uses unique members reached, the gap may be measurement noise, not performance.
Diagnosing Distribution Health
Reach expansion is one of the most useful diagnostic signals in LinkedIn's combined post analytics. LinkedIn separates in-network impressions from out-of-network impressions, helping you see whether content is circulating among existing followers and connections or reaching people beyond that immediate network. LinkedIn's combined analytics documentation also defines engagements to include reactions, comments, saves, sends, and reposts in that view.
A high out-of-network share usually means your post is escaping your current audience. That can create discovery among prospective clients, future collaborators, recruiters, or industry peers. Predominantly in-network delivery suggests that the post resonates, if it does resonate, within an established circle but isn't expanding your visibility.
Read distribution and response together
Don't label out-of-network exposure as good by itself. Pair it with engagement rate and the interaction mix.
| Pattern | Likely diagnosis | Practical response |
|---|---|---|
| High out-of-network distribution, weak engagement | The hook reached new people but the message didn't fit them | Tighten the opening and clarify the audience |
| Low out-of-network distribution, strong engagement | Existing followers care, but the post isn't travelling | Improve shareability and topic discoverability |
| High in-network delivery, strong comments | The topic has relevance inside your community | Build a series or adapt it for adjacent audiences |
| Broad delivery, mostly passive clicks | The post attracts curiosity without strong commitment | Strengthen the argument and call to action |
This isn't an algorithm cheat sheet. It's a way to locate the problem. If distribution is narrow, work on discoverability, topic framing, and formats that people are willing to share. If distribution is broad but response is weak, stop blaming reach and examine message-audience fit.
Reach tells you where LinkedIn delivered the post. The response tells you whether delivery was deserved.
Use the same diagnostic by topic and format rather than averaging everything together. A video, poll, article, and short-form text post serve different jobs. Portfolio-level analysis across those formats is more useful than declaring one universal format superior.
For a deeper look at who is responding to your content, use the follower insights for LinkedIn. Audience relevance should influence your next editorial decision, not just appear in a report that nobody acts on.
Why Reach Is Not the Same as Impact
A post with fewer impressions can be more valuable than a widely distributed post. That isn't a consolation prize. For an executive, consultant, recruiter, or B2B seller, the right reader often matters more than the largest possible audience.
Raw reach is a distribution metric. It answers, “How widely did LinkedIn display this?” It doesn't answer, “Did a qualified buyer understand my position?” or “Did a potential hire decide to contact me?” The difference is especially important when your objective is trust, authority, pipeline, or professional reputation.

Value the actions that require intent
Reactions are easy to give and easy to overvalue. Comments require more effort, saves indicate future utility, sends suggest private sharing, and profile clicks show that the reader wants more context about the person behind the post. These actions aren't identical, but they generally provide stronger clues than passive exposure.
A useful performance classification looks like this:
- High reach, low relevance: Many people saw the post, but few actions came from the audience you want.
- Low reach, high intent: Distribution was limited, but the people who did respond showed useful interest.
- High reach, high intent: The message travelled and attracted meaningful action. Study the topic, format, and framing.
- Low reach, low intent: Rework the premise before producing more posts in the same direction.
The last step is to connect analytics with outcomes you can observe. Track whether a post leads to qualified profile visits, newsletter subscriptions, applications, sales conversations, or introductions. LinkedIn analytics won't prove causation on its own, but it can help you identify which content deserves closer examination.
Don't force every post to generate a lead. Some posts build familiarity, explain your expertise, or give your audience language for a problem. Still, declare the intended job before publishing. A brand-awareness post and a consultation invitation shouldn't be judged by the same success criteria.
Turning Insights Into Strategy
Analytics become useful when they change what you publish next. The cleanest process compares similar posts within similar time windows, then separates distribution from response. Don't compare a short text post from one period with a video from a different period and call the difference a trend.
Start with a consistent review
Record each post's topic, format, impressions, members reached, engagement rate, and interaction mix. Add profile visits or other downstream signals when they're available. Then group the results by the variables you can control:
- Topic: Which problems attract thoughtful response?
- Format: Does your audience respond differently to text, images, videos, events, polls, or articles?
- Audience: Are the people engaging relevant to your professional goal?
- Call to action: Do readers comment, click, save, send, or visit your profile?
- Timing window: Are you comparing posts published under broadly similar conditions?
Calculate interactions ÷ impressions for efficiency, but don't stop there. Inspect whether the interactions came from passive clicks, reactions, or higher-intent comments, saves, sends, and shares. Then compare the pattern with audience relevance.
Turn patterns into editorial decisions
If a topic produces strong engagement but weak out-of-network delivery, keep the subject and improve the hook. If a format expands distribution but attracts irrelevant attention, preserve the format while narrowing the claim. If several posts generate profile visits but no conversations, review your profile positioning and the next step you offer visitors.
Recycle ideas, not identical posts. A strong argument can become a short text post, a document, a video script, or a response to a recurring audience question. That gives you a way to test whether the insight works across formats without confusing one successful execution with a universal rule.
For a broader approach to connecting content activity with measurable decisions, review the guía práctica de Ploot. You can also use this guide to measure content performance without reducing every result to a single engagement score.
RedactAI is one option for professionals and agencies that want to review post performance, identify top-performing posts, access current statistics, and use a monthly performance report alongside LinkedIn content work. The important part is the operating rhythm: publish, measure, diagnose, adjust, and document what changed.
Key Takeaways and Next Steps
LinkedIn analytics make sense when you read them as a sequence rather than a scoreboard. Impressions show estimated distribution. Members reached clarifies unique audience breadth. Engagement rate shows interaction efficiency, while the interaction mix reveals whether people reacted lightly or took a more deliberate action.
Distribution health comes from the in-network and out-of-network split. Impact comes from connecting those signals with audience relevance, profile visits, conversations, subscriptions, applications, or opportunities. A large audience can be useful, but it isn't automatically a valuable audience.
Use this checklist during your next review:
- Define the job: Decide whether the post is meant to build trust, teach, start a conversation, attract candidates, or support demand generation.
- Check distribution: Compare impressions with members reached, then inspect the in-network and out-of-network split.
- Separate response from exposure: Calculate interactions divided by impressions and review the interaction types behind the result.
- Assess relevance: Look at who engaged, not just how many people engaged.
- Compare fairly: Group posts by similar topic, format, and time window.
- Choose one adjustment: Change the hook, audience framing, format, call to action, or recycling plan, then measure the next comparable post.
Reviewing analytics without changing your editorial decisions is just dashboard tourism. Set a recurring review, keep your definitions consistent, and judge each post against the outcome it was designed to support.
RedactAI helps professionals and agencies create LinkedIn posts, review performance, identify top-performing content, and use analytics to refine future publishing. Visit RedactAI to turn your LinkedIn data into a more consistent content and measurement workflow.