Worldwide advertising expenditure was projected to exceed US$1 trillion for the first time in 2024, according to WARC's global ad spend outlook. That's a striking spending milestone. It isn't proof that every advertiser earned more, every agency grew, or every creator found an audience. Useful industry growth insights explain that difference before turning a big number into business advice.
What Industry Growth Insights Really Mean
An industry growth insight is a conclusion about where a sector is expanding, why it's expanding, and whether that expansion can last. It's backed by evidence, not just an exciting headline.
Global generative-AI adoption reached 16.3% of the world's population in the second half of 2025, up from 15.1% in the first half, according to Microsoft's AI Economy Institute. That tells you something about use. It doesn't tell you whether those users became more productive or whether their employers earned more.
Think of a trend headline as today's weather. An insight describes the climate pattern behind it. A sunny afternoon doesn't establish a dry season, just as a jump in tool usage doesn't establish durable business growth.
Follow the money, the users, and the results
Say you advise a recruitment agency considering AI-assisted candidate outreach. You'd want to separate several kinds of evidence:
- Spending: What employers pay for software, implementation, and training.
- Adoption: Whether recruiters use the tools in their daily work.
- Outcomes: Whether recruiters place suitable candidates faster without lowering placement quality.
These are different questions. A software vendor's rising revenue can establish demand for its product without proving that recruiters get better results.
Use this distinction when discussing growth with colleagues or clients.

For LinkedIn creators, the opportunity is interpretation. A dated, properly scoped finding gives readers something they can evaluate. Your explanation should connect it to a decision, such as whether to invest, experiment, hire, or wait.
Try this: Pick a trend in your sector. Write down its spending evidence, adoption evidence, and outcome evidence. Leave a category blank if you can't support it. That blank is a useful warning, not a writing problem to hide.
Data Sources Worth Trusting and What Each One Tells You
Common industry growth data sources and what they answer
| Source | What it measures | Best use | Main limit |
|---|---|---|---|
| WARC | Global advertising spend and forecasts | Sizing channel budgets | Forecasts, not final spend |
| McKinsey State of AI surveys | Organizational AI adoption by business function | Spotting which functions are adopting | Self-reported survey answers |
| LinkedIn business research | Posting volume, video growth, and B2B influence | Planning platform-specific content | Platform-owned data |
| Global Entrepreneurship Monitor | Startup activity and survival gaps | Checking who is excluded from growth | Annual cycle, so results lag |
| Microsoft AI Economy Institute | Population-level generative-AI use | Market reach context | Check methods before comparing countries |
| WPP Media forecasts | Global ad revenue and digital share | Mid-year market direction | Forecasts can be revised |
| IMF and World Bank reports | Macro growth and productivity scenarios | Long-run economic context | Scenarios aren't actual results |
Choose a source according to the question, not its reputation alone. WARC helps you examine advertiser budgets. WPP Media offers another view of the advertising market, but spending and revenue aren't automatically interchangeable.
For example, global advertising revenue was projected to reach $1.08 trillion in 2025, with digital advertising expected to represent 73.2% of the total, according to WPP Media's mid-year forecast. Preserve the word projected. Rewriting that sentence as a confirmed result would change what the source establishes.
Match the source to the decision
McKinsey's surveys help you examine organizational behavior. Read the respondent group, business function, and definition of adoption before comparing findings. An employee trying a tool isn't necessarily the same as an organization embedding it in a workflow.
LinkedIn's business research is useful for platform decisions. It can inform content experiments, but it shouldn't stand in for evidence about every professional channel. Microsoft's population-level reporting answers a different question again: how broadly people use generative AI.
For questions about business formation and survival, consult the Global Entrepreneurship Monitor. For economy-wide effects, look to macroeconomic reports and inspect their assumptions. Don't use a long-run scenario as evidence that a company has already improved its margins.
Practical rule: Corroborate a headline with another source that measures the underlying trend differently. Don't average incompatible figures.
A survey about adoption and financial reporting about operating performance can complement each other without producing matching percentages. If they disagree, explain the mismatch rather than forcing agreement.
Apply the same discipline when benchmarking against competitors: compare the same market, reporting period, and measure. A rival's audience growth and your sales growth belong in different columns.
Metrics That Separate Real Growth From Hype
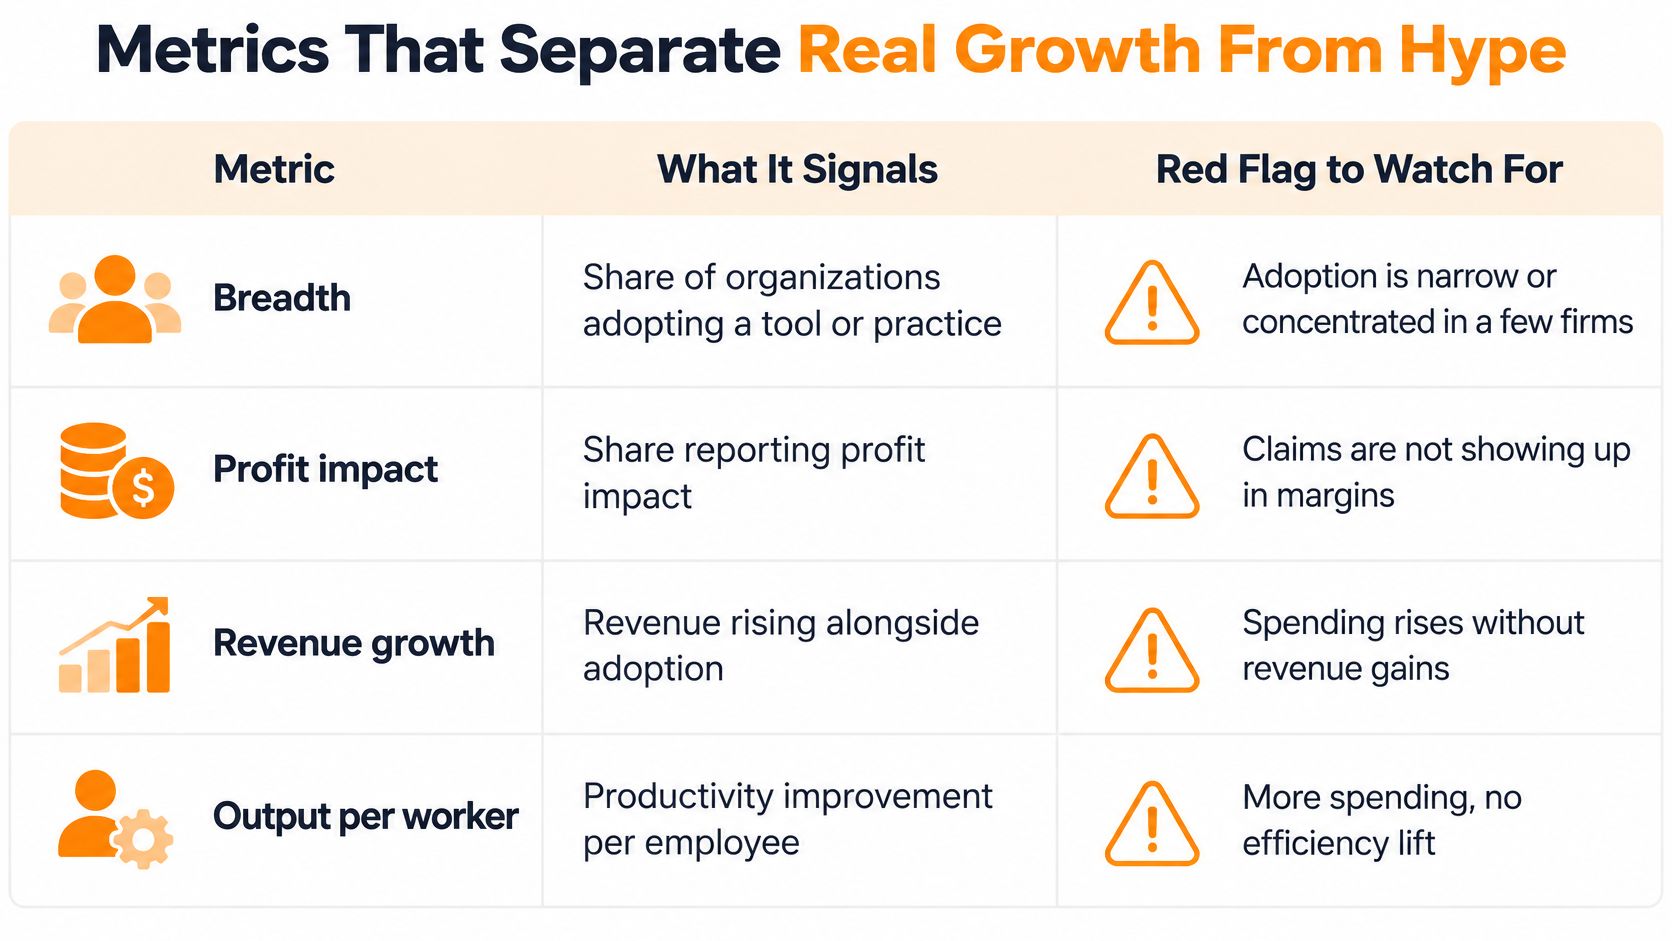
The gap between widespread AI use and limited reported profit impact is a useful starting point. Adoption measures participation. Profit impact measures a reported business outcome. Don't treat them as synonyms.
Growth metrics, what they signal and red flags
| Metric | What it signals | Red flag |
|---|---|---|
| Share of organizations adopting | Whether growth is spreading across the sector | Adoption rises while profit stays flat |
| Share reporting EBIT impact | Whether adoption translates into profit | Only 39% reported any enterprise-level EBIT impact in McKinsey's 2025 survey, although 88% regularly used AI in at least one business function |
| Output per worker | Real productivity gains | Gains appear only in selected, structured tasks |
| Engagement rate per impression | Audience response relative to reach | High impressions with few interactions |
| Posting volume growth | Supply of competing content | Volume rises faster than engagement |
Read the metrics together. Broad adoption with weak financial results may reflect implementation costs, incomplete workflow changes, or benefits that haven't reached enterprise-level reporting. It doesn't establish that AI never works, and it doesn't establish that adoption guarantees returns.
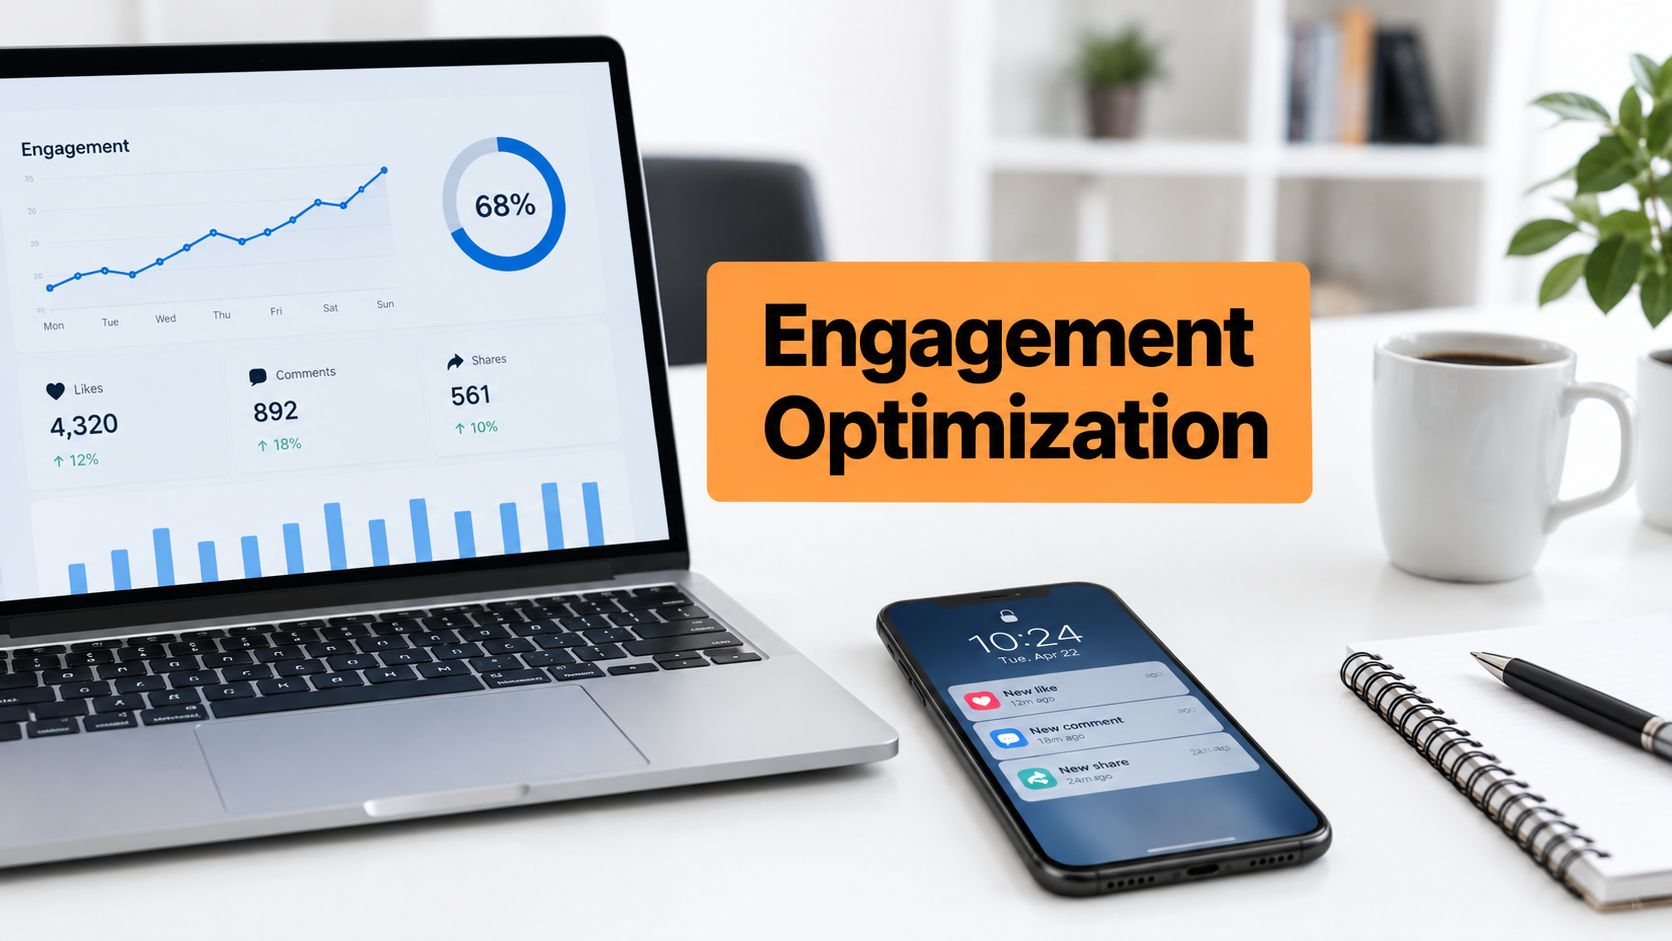
The visual provides a compact check on the distinction between activity and outcomes.
Measure what happened after the activity
For output per worker, hold quality reasonably constant. A marketing team producing more drafts hasn't necessarily improved productivity if editors spend longer correcting them. Track usable work, not just generated work.
Content needs the same discipline. High impressions with few relevant interactions suggest distribution without much response. Posting more frequently can increase total exposure while leaving audience relevance unchanged.
Use the accompanying video as another prompt for evaluating growth claims against measurable results.
Build a spreadsheet dashboard with columns for publishing consistency, engagement per impression, and identifiable target-audience profile visits. Add a review-date field and assess it monthly.
Define the engagement calculation before using it. Keep the same included interactions and denominator across posts. Where visitor identities aren't available, record the limitation instead of guessing whether viewers match your target audience.
How to Read a Trend Without Getting Fooled
AI-related technology investment was estimated to add 0.5 percentage points to U.S. GDP growth in 2025, while the World Bank baseline described in the IMF's discussion of AI deployment and disruption assumes about 0.8% annual productivity growth in the 2020s and 2030s. These measures answer different questions: investment can contribute to economic activity without demonstrating widespread improvements in productivity.
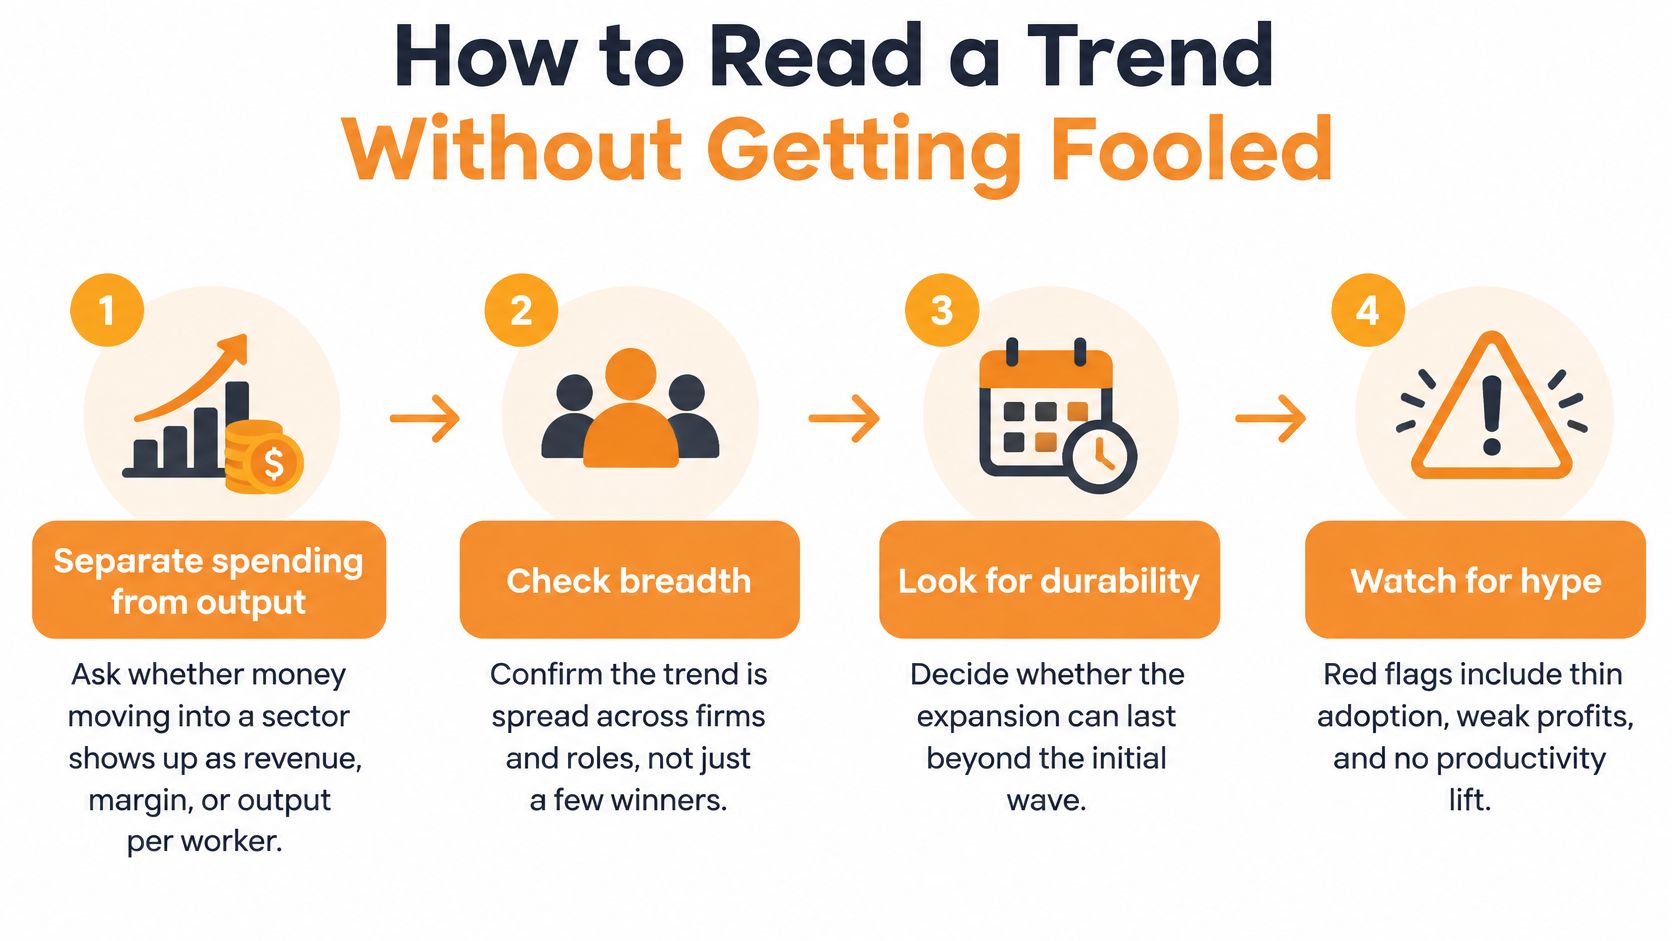
Use a repeatable decision process rather than deciding whether a headline feels convincing.
Test the claim before choosing a position
Trace spending to operating results. Ask whether the investment shows up as revenue, margin, or usable output per worker for the adopting business. The common slip is treating a supplier's strong sales as proof that its customers are more productive.
Check breadth across firms and roles. Use the adoption and profit-impact measures to identify whether results extend beyond prominent leaders. A case study from a well-funded company may be useful, but it doesn't establish what a smaller competitor can achieve.
Compare promises with subsequent reporting. Put announced budgets beside realized results across successive reporting periods. Keep the definitions consistent, and don't compare an annual investment commitment with a short-term revenue change as though they cover the same interval.
Identify who receives the spending. Data-center builders, semiconductor suppliers, and power-equipment manufacturers can receive orders before downstream businesses demonstrate better performance. Separate infrastructure demand from benefits claimed by the organizations buying access to that infrastructure.
Choose a baseline and a failure condition. Compare optimistic claims with a clearly labeled baseline, then decide what evidence would weaken your interpretation. The common mistake is moving the goalposts whenever the expected result fails to appear.
A practical guide to trend analysis can help you organize observations over time. Use it to distinguish a temporary surge from a pattern that survives changes in budgets, demand, or implementation conditions.
A useful interpretation includes something that could prove it wrong.
Say an agency introduces AI-assisted reporting. Its initial output rises, but staff spend longer checking inaccurate summaries. Your verdict shouldn't be that automation succeeded just because more reports were generated.
Use this format: Trend: what appears to be changing. Evidence: the comparable observations supporting it. What would prove it wrong: the result that would make you revise the claim.
Who Gets Left Out of Industry Growth
Aggregate growth can hide people and businesses that don't benefit. A sector can generate more revenue while smaller firms struggle to survive, junior workers lose entry routes, or businesses in poorly connected regions fall behind.
The Global Entrepreneurship Monitor's global report identifies a Survival Gap, where too few startups become established companies, and an AI Readiness Gap between organizations able to deploy AI effectively and those lacking skills, capital, or infrastructure. Its labor discussion also reports that employment for U.S. software developers aged 22–25 fell nearly 20% from 2024.
That employment finding deserves careful wording. It concerns a particular age group, occupation, and country. It doesn't mean software employment fell everywhere, and it doesn't establish that AI alone caused the change.
Ask who can capture the benefit
Consider a small consultancy and a large enterprise buying similar AI tools. The enterprise may have dedicated operations staff, cleaner internal data, and legal support. The consultancy may need its owner to handle implementation between client assignments.
Access to the same software doesn't remove those differences. Nor does faster task completion automatically tell you who receives the financial benefit. A consultant might retain the savings, reduce prices, or absorb additional client demands.
Use these segmentation questions before presenting growth as broadly beneficial:
- Company maturity: Are established firms improving while young businesses struggle to survive?
- Worker age and experience: Are junior employees gaining supported entry routes or losing opportunities to learn?
- Role complexity: Does the improvement cover the whole job or only a repeatable task within it?
- Market access: Can smaller firms and less-connected regions obtain the skills, infrastructure, and customers they need?
Balanced framing: Name the beneficiaries and the people facing transition costs in the same post.
For recruiters, that might mean discussing training alongside hiring efficiency. For agency owners, it might mean explaining how productivity changes affect junior development and client pricing. You don't need an alarmist conclusion. You need a clear account of who gains, under what conditions, and who needs support.
Turning Growth Signals Into LinkedIn Posts
From insight signal to LinkedIn post angle
| Insight signal | Post angle | Format |
|---|---|---|
| Spending shifts to measurable channels | Why budgets are moving to performance-tracked formats | Short text post with a chart |
| Adoption jumps in a business function | What changed in that function and what to test | Carousel with a checklist |
| Your video views grow faster than your text results | Test a video version of your take | Captioned short video |
| Productivity gains are uneven | Who wins and who pays the transition cost | Opinion post ending with a question |
Match the format to the explanation. A spending comparison benefits from a labeled chart. A workflow change suits a carousel because readers can move from the finding to a practical checklist.
Keep platform claims precise. LinkedIn's business research reports that video creation increased 27% in a year while video views grew 36%. That supports testing video, but it doesn't establish that video views grew faster than text performance. Use your own comparable post results before making that claim.
Choose a decision, not just a topic
The global creator-economy market was valued at $207.45 billion in 2024 and projected to reach $852.08 billion by 2031, according to The Insight Partners. That's market context, not a promise about an individual creator's earnings or reach.
Your audience still needs a reason to read your interpretation. Choose an insight that's recent enough to matter, traceable to a source, and tied to a decision. For a sales leader, that decision might concern prospecting priorities. For a recruiter, it might concern training or role design.
Try a post built around a hypothetical marketing team:
- Finding: The team can produce drafts faster.
- Interpretation: Drafting speed matters only if approval time and quality hold up.
- Action: Track approved work and editing effort before expanding the workflow.
This is more useful than declaring that AI has transformed marketing. It gives readers something to test.
Browse industry insight examples for ways to connect evidence with a specific professional question. Borrow the reasoning structure, not someone else's conclusion.
Before publishing, check that the post names its source, states the implication in a clear sentence, and tells readers what to do or watch next. Preserve the original population, period, and forecast language. A punchier hook isn't worth an inaccurate claim.
Start Your Weekly Insight-to-Post Routine
A sustainable routine should produce a defensible opinion, not a folder full of unread reports. Keep a source log in Google Sheets or Excel with fields for the finding, publication date, measurement period, audience relevance, and source URL.
Move from observation to a publishable argument
Choose a finding connected to your work. Pick a question your clients, colleagues, or prospects face, then collect evidence that helps answer it. Don't select a statistic because it's large or surprising.
Apply the second-source rule. Record whether the supporting evidence strengthens, narrows, or contradicts your initial interpretation. If you can't corroborate the headline, reduce the claim rather than hiding the uncertainty.
Write the implication before the hook. Finish the sentence, “For my audience, this means…” with a practical consequence. If the answer is only “this trend is important,” you haven't reached an insight yet.
Choose the angle and prepare the draft. Match the explanation to text, a carousel, or video, and retain the source attribution during editing. We offer RedactAI as one option: it generates complete LinkedIn posts from a few keywords using your profile information, posting history, real-time industry insights, and relevant online data; our Done For You service also schedules posts at peak engagement times.
Schedule, then evaluate. Choose a time informed by your audience's activity and set a review reminder for a fortnight after publication. Don't declare success from an early burst of impressions or abandon an angle before checking who responded.
Keep the feedback useful
At the fortnight review, examine engagement per impression and profile visits from your target audience, where identifiable. Log them in the dashboard alongside publishing consistency, using the definitions you established.
Read the comments as well. A thoughtful question from a relevant buyer can reveal more about the next useful topic than a broad reaction count. Record the question, not just the total interactions.
Use the result to choose a specific adjustment: narrow the audience, explain the mechanism more clearly, change the format, or test a different decision angle. That turns industry growth insights into an ongoing editorial practice rather than occasional commentary on big numbers.
RedactAI helps you turn a few keywords into complete LinkedIn posts using your professional context and real-time industry insights. Visit RedactAI to build a publishing routine around sourced findings, clear interpretations, and decisions your audience faces.