A LinkedIn post impression is one estimated on-screen show of a post, not one unique person and not proof anyone read it.
The popular advice is to chase a bigger total: post more, sharpen the hook, repeat whatever got attention. That skips the question that matters. Did more people encounter your work, or did LinkedIn show it repeatedly to the same audience?
Before you rewrite your content strategy around a rising graph, check what the graph measures. A larger total can reflect wider discovery, repeated delivery, or a change in how LinkedIn counts exposure.
What a LinkedIn Post Impression Counts
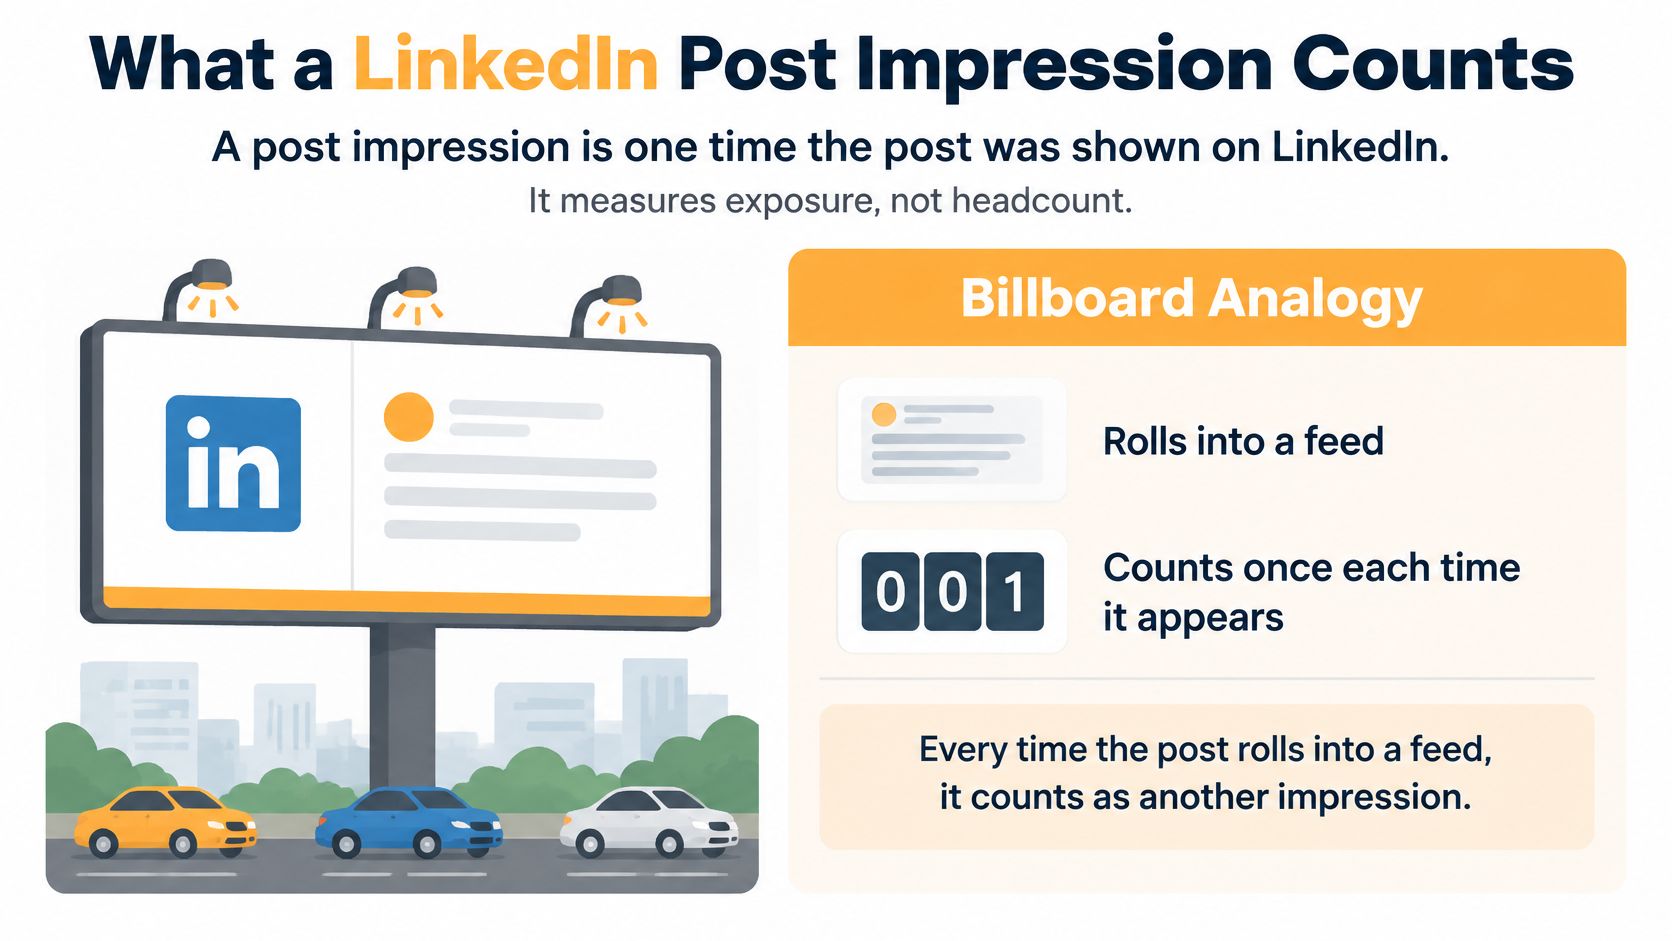
A post impression means your post was shown on LinkedIn. In its post analytics guide, LinkedIn defines impressions as displays, describes analytics as estimates that may not be precise, and separates exposure from inside and outside your network.
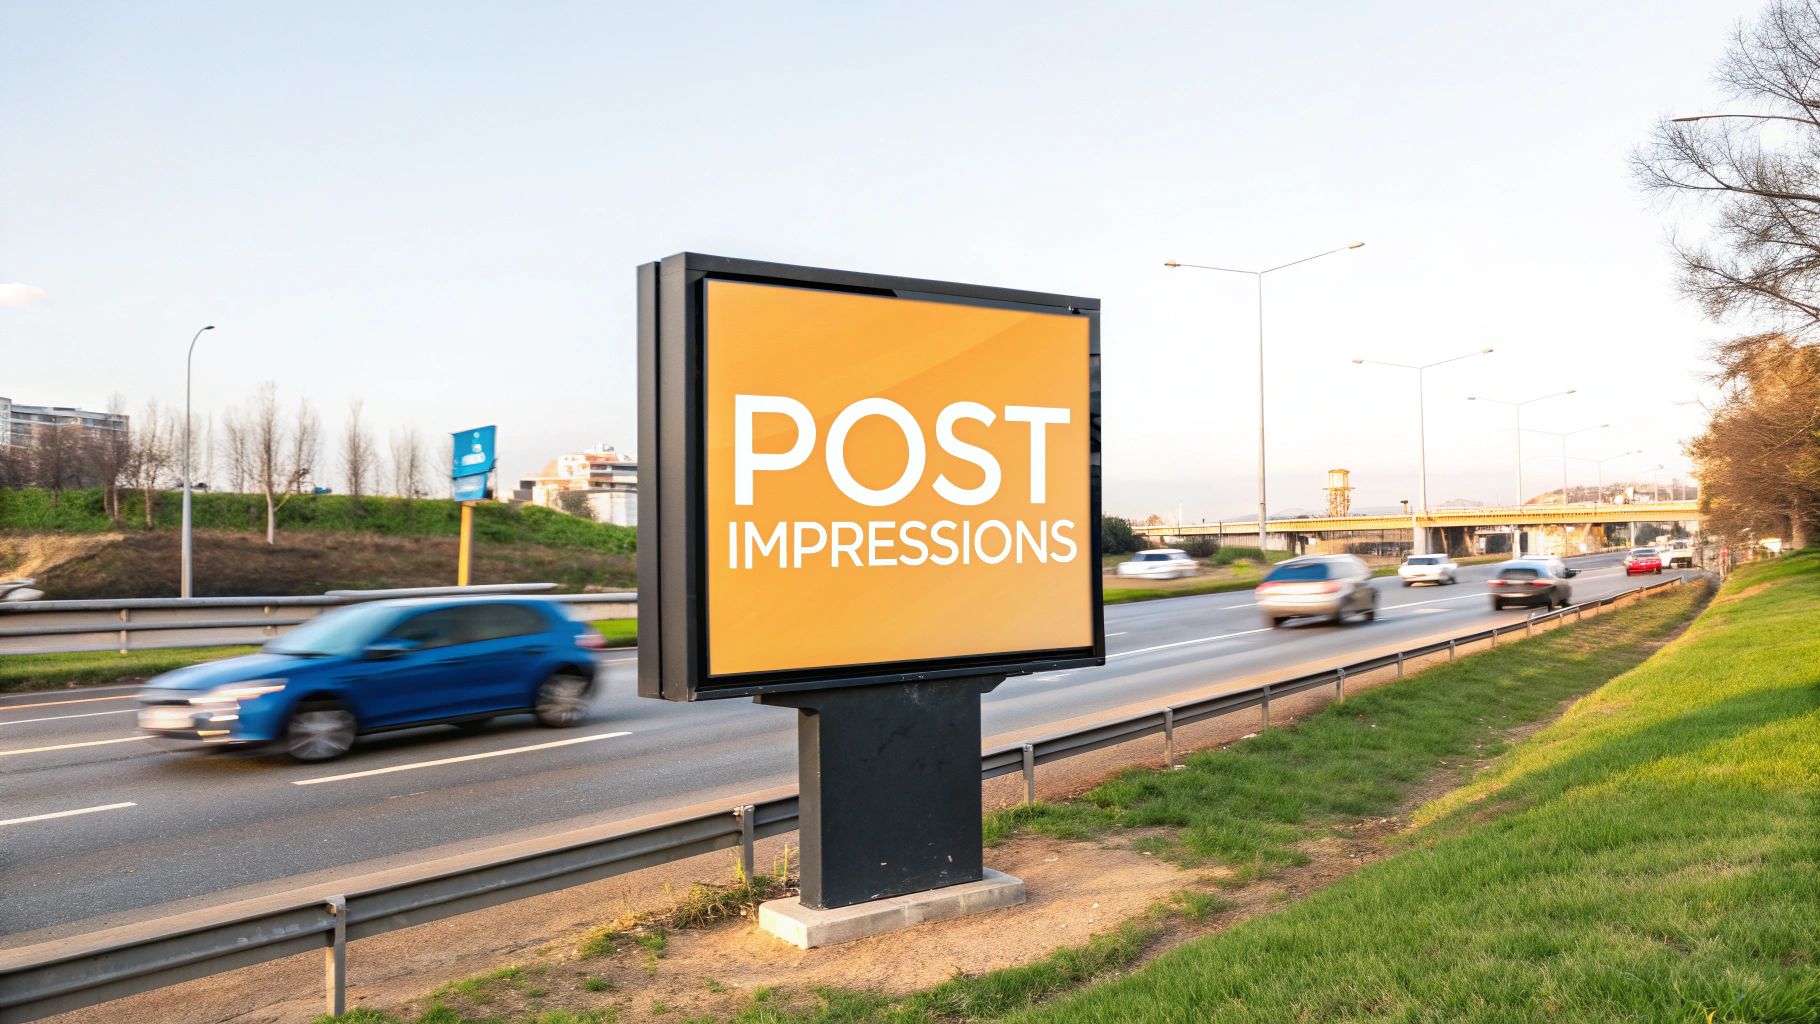
Think of a roadside billboard. The traffic counter records passing opportunities to see the sign, not a verified list of people who read it. A commuter who passes again creates another exposure opportunity without becoming another person.
Impressions versus the metrics people confuse them with
| Metric | What it counts | Best used for | Common misread |
|---|---|---|---|
| Post impressions | Estimated times the post was shown, including repeats and exposure attributed through reposts | Exposure volume | Treating the number as unique readers |
| Members reached | Distinct members who saw the post | Audience size | Assuming it equals impressions |
| Views | Plays or opens, according to the content format, rather than every feed appearance | Attention on videos or articles | Equating a view with an impression |
| Engagements | Reactions, comments, reposts and clicks | Response after exposure | Assuming more impressions always mean more engagement |
| In-network impressions | Shows to connections and followers | Existing-audience delivery | Reading them as viral reach |
| Out-of-network impressions | Shows to people outside those relationships | Discovery beyond the network | Ignoring them when judging distribution |
Start with the distinction between displays and people. Someone might encounter your post on their phone, then encounter it again while browsing on a desktop. Those appearances can increase exposure without expanding the audience.
Members reached is the closer stand-in for audience size. Views answer a format-specific question, such as whether someone played a video or opened an article. Neither should be casually substituted for impressions.
Engagements tell you what happened after exposure. A reader can see your post without reacting, and a reaction doesn't establish that they absorbed the argument or opened your offer.
The billboard analogy makes that separation easier to remember.
Check where the exposure came from
The network split adds a distribution story. In-network impressions suggest delivery to people already connected to you or following your work. Out-of-network impressions suggest the post traveled beyond those relationships through discovery or sharing.
Neither category is automatically better. A recruiter may want relevant candidates outside their network, while a consultant announcing availability may benefit from familiar contacts remembering their expertise.
Read the total beside members reached and the network split. Otherwise, you're looking at traffic without knowing whether it brought new visitors.
Also separate formats before declaring a winner. LinkedIn analytics covers text posts, images, videos, polls, events and articles, but those formats ask different things of a reader. A useful portfolio total isn't necessarily a fair performance contest.
Why Totals from Before April 2024 Do Not Match
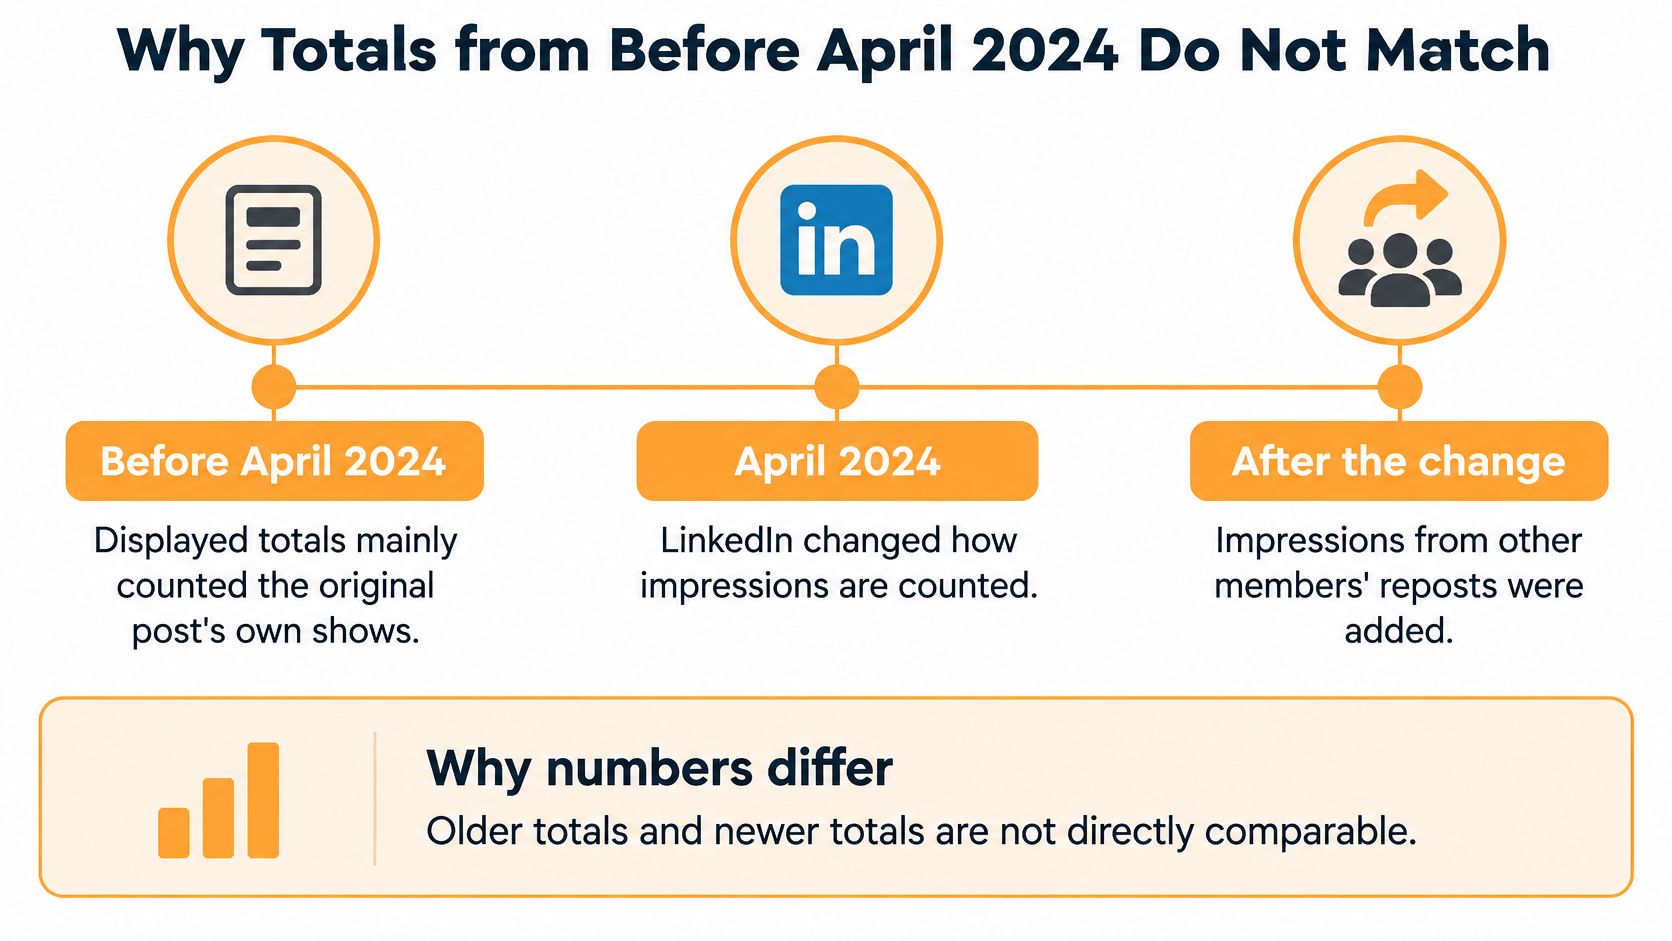
April 2024 is a measurement break: LinkedIn began including impressions from other members' reposts alongside impressions from the original post, and warned that reported totals could increase, according to its impression-counting update.
Historical comparisons also face an availability problem: LinkedIn's analytics retention documentation describes discovery and social-engagement data availability of up to 1,000 days for many content types, compared with 400 days for members-reached data.
That gives you separate reasons an old post and a recent post might not make a clean comparison. Their impression totals may follow different counting rules, and their available audience metrics may no longer match.
The timeline shows where the counting changed.
A stronger total isn't automatically stronger writing
Say a consultant compares an older article announcement with a recent post that colleagues reposted widely. The recent post has a larger impression total, so the consultant decides its opening was much better.
That's possible, but the total alone doesn't prove it. The newer reporting includes a broader set of displays. Without accounting for that difference, the consultant is partly comparing measurement methods rather than content.
Don't try to repair the comparison by guessing how much exposure came from reposts. If you can't isolate comparable measures, keep the periods separate.
Keep a usable historical record
Preserve enough context that your future self can understand the result:
- Save the measurement date. A snapshot taken shortly after publication isn't equivalent to a mature lifetime total.
- Record the format and follower count. Audience growth and a change in publishing mix can explain apparent improvement.
- Keep the underlying export or screenshot. Missing reach data later shouldn't force you to reconstruct it from memory.
- Mark the methodology boundary. Keep older and newer counting eras visibly separate on charts.
An export saved while audience data was available can preserve information that disappears from the live dashboard later. But a fresh export of an old post may already lack that context.
Use historical totals to identify promising themes within comparable periods. Don't turn a discontinuous chart into a precise claim about improved readership.
Typical Impression Benchmarks by Audience Size
LinkedIn impression benchmarks to compare against
| Slice | Figure | What it describes | Source year |
|---|---|---|---|
| Average post, all accounts | About 696 impressions, according to Statista data reported by Grou Global | Broad average post exposure | 2023 |
| Average post, all accounts | About 1,057 impressions in 2024, falling to about 812 in 2025, according to Statista | Annual averages spanning the counting-method transition | 2024 |
| Average post, all accounts | About 812 impressions | Average exposure after the methodology change, from the Statista comparison above | 2025 |
| Accounts with up to 500 followers | About 68 impressions per post, according to Statista's account-size benchmark | Small-account baseline | January 2024 |
| Top 20% of brands | Average reach of 20% of followers per post, while one in five brands reached only 4%, according to Rival IQ | Strong brand distribution, not a personal-profile target | 2023 |
| Bottom fifth of brands | About 4% of followers reached per post | Lower brand reach in the Rival IQ comparison above | 2023 |
The useful row is the closest match to your account, not the largest number. A small personal profile shouldn't judge itself against an aggregate that doesn't identify a matching follower bracket.
Also notice that this table mixes impressions and follower reach. Those aren't interchangeable measures. A brand's share of followers reached doesn't tell a solo consultant what their impression total should be.
Use averages as context, not a quota
Published averages help answer whether a result looks wildly out of place. They don't tell you what your next post deserves.
An average isn't a median, either. Unusually visible posts can pull an average upward, so don't assume the average describes the middle-performing creator. You need your own repeated results to establish that baseline.
The annual figures don't establish a neat story about content getting better and then worse. The counting transition complicates the comparison, and these sources don't isolate how much of the movement came from measurement rather than distribution. Comparing more distant years doesn't remove that problem.
Benchmark rule: Match the account type, audience size, metric and measurement period before borrowing someone else's target.
A recruiting specialist reaching relevant hiring managers may have a useful post without approaching a broad platform average. Conversely, a widely distributed post about an unrelated topic may do little for that specialist's work.
Keep organic and paid comparisons separate
Format and promotion introduce another mismatch. If you're planning sponsored video alongside organic posting, ContentBuck's guide to compare LinkedIn video ad formats can help you separate ad-format decisions from organic performance analysis.
Don't treat a paid campaign's delivery as the standard your personal posts must meet. Budget, targeting and campaign objectives change the comparison.
For a separate discussion of unusually broad distribution, use our guide to what is considered viral on LinkedIn. Virality is a different question from whether your regular posts are reaching a useful audience consistently.
The practical benchmark is a repeatable improvement among comparable posts, with relevant people responding. A borrowed average is only context for that judgment.
How to Read a Rise Without Fooling Yourself
Exposure frequency = impressions ÷ members reached. Use that ratio to check whether a bigger total reflects broader delivery or more repeat exposure, then inspect engagement for evidence of attention; LinkedIn's discussion of feed dwell time reinforces why display volume alone doesn't establish meaningful viewing.
Treat frequency as a diagnostic, not a quality score. Repeat exposure can help someone remember you. It becomes a concern when your goal is discovery but the audience stops expanding.
Separate the patterns
| Pattern | What you see | What to investigate |
|---|---|---|
| Expanding | Impressions and members reached rise together | Whether the additional audience is relevant |
| Saturating | Impressions rise while members reached stays flat | Whether repeat delivery is replacing discovery |
| Skipped | Impressions rise while clicks and engagements stay flat | Whether the opening or topic failed to earn a response |
The skipped label is shorthand, not proof of scrolling behavior. Quiet readers exist, and you can't infer their dwell time from a lack of reactions. Use the label to flag a post for review, not to claim you know what every viewer did.
Likewise, expanding doesn't automatically mean commercially useful. Check who joined the conversation and whether their roles fit the audience you intended to reach.
Read response quality alongside delivery
Build a compact review around the signals you can access:
- Reactions and comments. Look beyond volume to whether people discuss the substance.
- Reposts. Inspect whether others add context that makes the content useful to their audiences.
- Clicks. Check whether the post prompted the next action it was designed to support.
- Business outcomes. Where available, connect profile activity, inquiries or conversions to the publishing effort without assuming every outcome came from the post.
A modest total with thoughtful questions from prospective buyers can be useful. A large total with no relevant response may reflect broad exposure.
Before crediting the copy, check what else changed. Did your follower base grow? Did you publish a different format, change topics, or measure the post after a longer interval?
Compare posts over consistent windows and use the median of a comparable batch. That keeps an unusual spike from becoming the standard every ordinary post appears to miss.
A rising total is a prompt to investigate, not a verdict that the writing improved.
Keep the labels in your tracking sheet. They make it easier to distinguish a distribution problem from an audience-fit problem before you start rewriting.
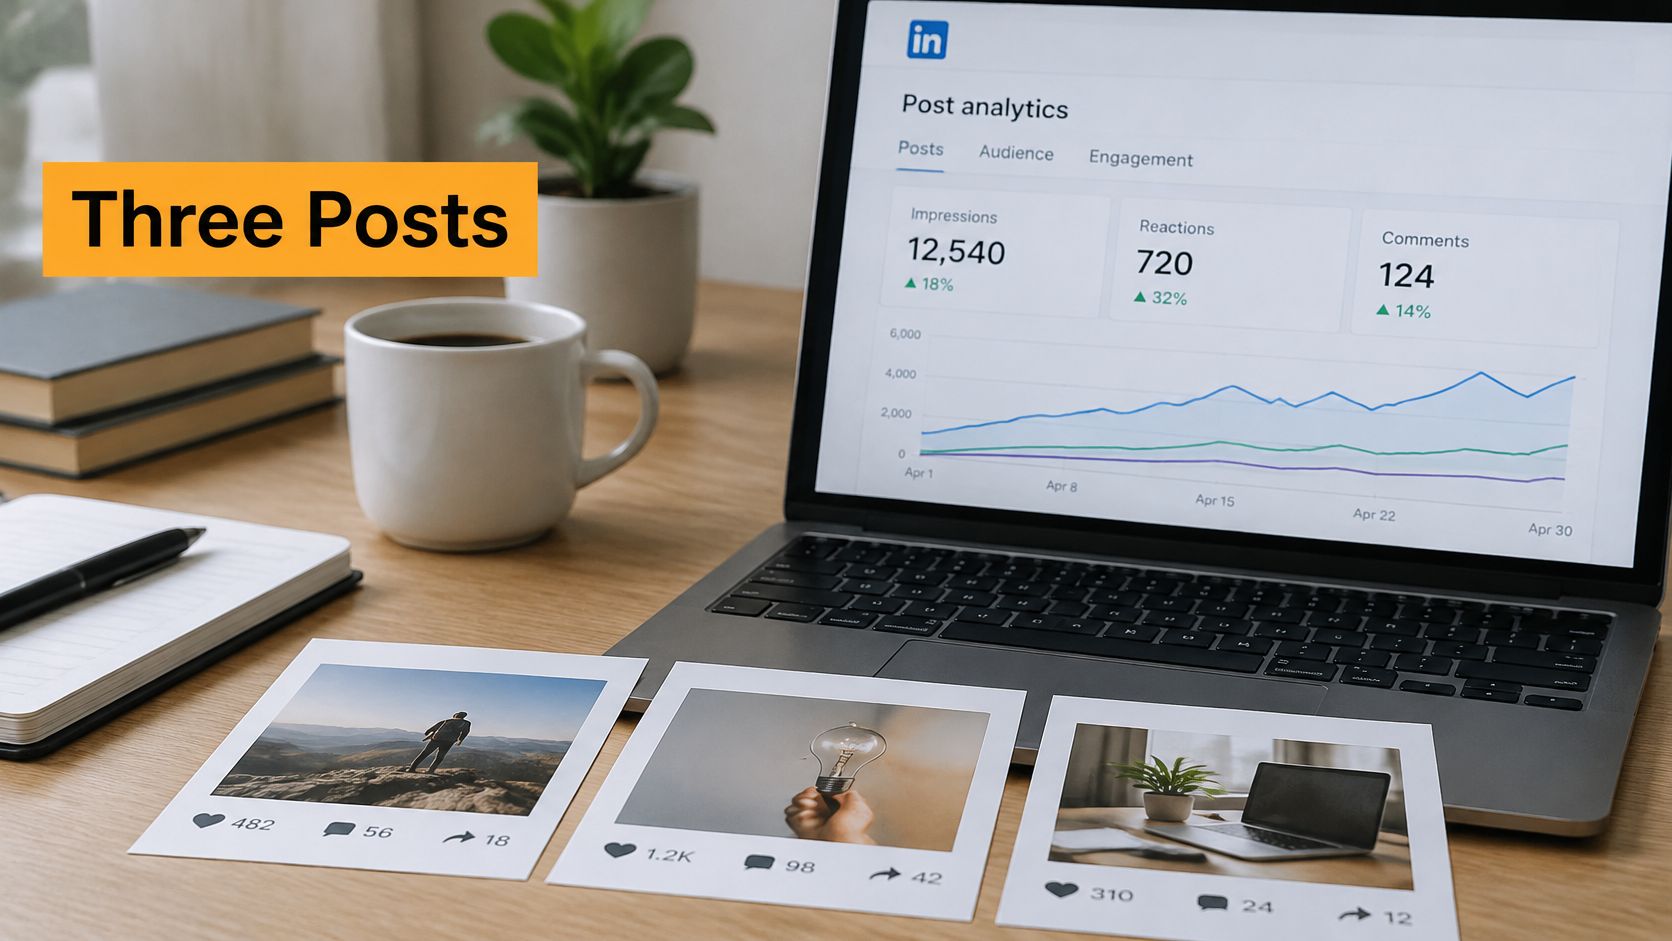
Three Posts and What Their Numbers Mean
Consider a hypothetical consultant reviewing a quiet post, a repeatedly shown post and a post that reached unfamiliar readers. These are illustrative patterns, not reported account results.
Keep the total, audience and response visible together while you review.
The quiet post that reached a little further
The consultant publishes a practical explanation of a common purchasing mistake. The total looks unimpressive, but members reached improves relative to their usual comparable posts, and familiar contacts ask useful follow-up questions.
Most delivery stays in-network. There's no reason to call it viral, but there's also no reason to throw out the topic because the total looks small.
The next move is to answer the strongest question in a new post and see whether that audience interest holds. Label: expanding.
The exciting total with the familiar audience
Later, the consultant publishes a sharper, more provocative opening. Impressions jump, but members reached barely changes, and the discussion stays with the same colleagues.
The consultant is tempted to copy the opening formula. Instead, they check frequency and recognize that the post has mainly been reshown to a familiar group.
That isn't worthless. It may reinforce a message, but it isn't evidence that the consultant has broken into a new audience. Label: saturating.
For another way to think through the analytics review, this video offers a visual companion.
The useful discovery post
Another post explains how to evaluate a vendor proposal. Members reached rises alongside impressions, the out-of-network share becomes more noticeable, and unfamiliar readers describe similar purchasing problems.
The consultant checks their roles rather than celebrating unfamiliar names alone. If those readers are the people the consultant wants to help, the post has a stronger distribution story than a large total confined to colleagues.
They also inspect repost activity. Someone else's explanation or endorsement may have introduced the idea to the right audience, so the consultant shouldn't credit the opening alone. Label: discovered.
Across these cases, the useful question changes from which total is biggest to which pattern is worth repeating. Judge that across a batch of similar posts before turning any snapshot into a permanent writing rule.
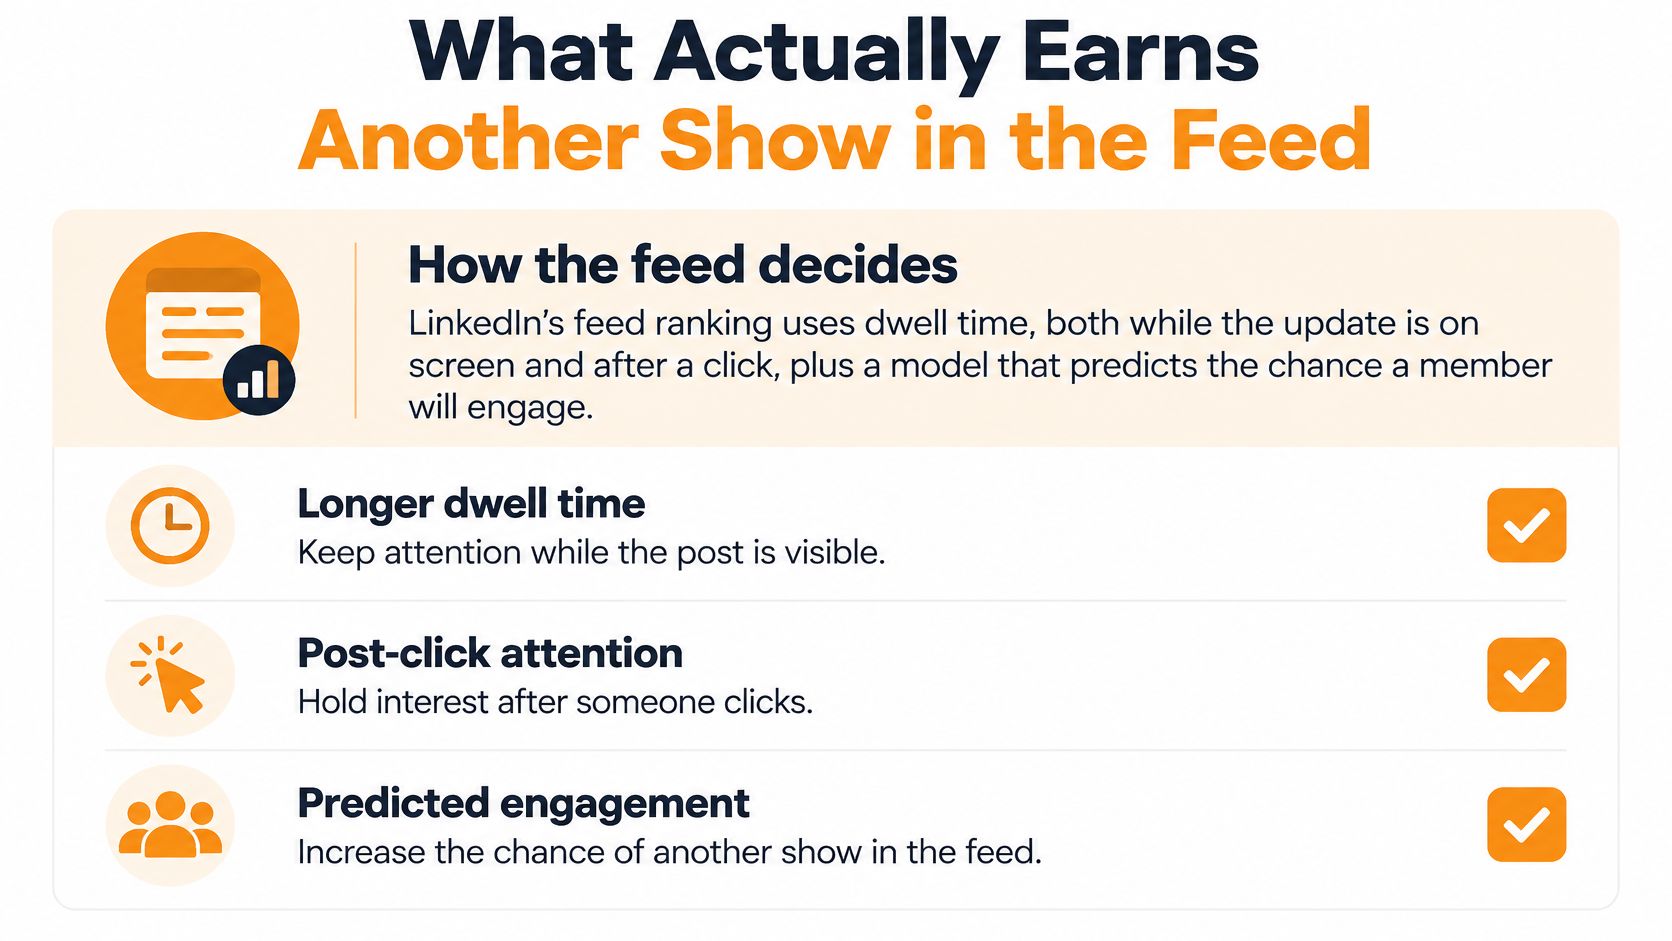
What Actually Earns Another Show in the Feed
LinkedIn's feed tends to favor posts that hold readers' attention rather than ones they quickly scroll past. Give the intended reader a clear reason to see the post as relevant, then make it worth continuing. That is a useful writing aim, not a formula for guaranteed distribution.
The feed's ranking involves multiple signals, and impressions remain an estimate of exposure. A post earning another show may reflect reader interest, but one result cannot establish exactly why it happened.
Give readers a reason to stay
Start with a concrete professional problem, an actionable distinction, or an outcome your audience cares about. Replace a vague announcement with the point itself.
A procurement consultant, for example, could open with a contract clause buyers often overlook, then explain how to spot it. That gives readers a reason to continue that “contract negotiation matters” does not.
Make the post easy to follow:
- State the problem clearly. Readers should understand who the post is for.
- Deliver the promised explanation. A strong opening should lead to useful substance, not an ordinary point dressed up as a dramatic hook.
- Use purposeful structure. Break paragraphs when the idea changes, not after every short phrase.
- Ask a specific question when useful. Invite relevant experience that adds to the discussion.
A click or comment matters in context. A click without a satisfying explanation, or a response prompted by a question unrelated to the post, does not show that the content held attention.
Run a controlled content test
Choose a topic family and format, and keep the publishing window reasonably consistent. Change the opening or supporting proof, not everything at once. This makes it easier to see which change may have affected the response.
At matching checkpoints, track impression velocity alongside click-through and comment quality. A faster start is only one part of the picture; consider what readers did after the post appeared.
Compare formats with your own audience instead of treating text, documents, or video as universally superior. Timing also provides context: a person browsing between meetings may respond differently from someone reading at leisure.
Use this guide to understand LinkedIn post visibility without treating each weak result as proof of a hidden penalty.
Test discipline: Choose the comparison before publishing. Otherwise, it is easy to select whichever metric makes the result look successful.
Keep your profile recognizable, too. If readers visit after seeing a post, this guide can help you improve your LinkedIn profile photo. A profile photo supports presentation, but it is not an impression-growth shortcut.
If comparable posts do not improve, revisit the audience fit or opening. Decorative formatting changes alone do not make an argument stronger.
Set a Baseline Before the Next Ten Posts
Before chasing a bigger number, build a simple record of your recent posts. Our LinkedIn post analytics guide can help you organize the review, but a spreadsheet is enough to establish a baseline.
Build the record
Use these fields consistently:
- Post details. Record the publication date, topic, format, opening and follower count at publication.
- Measurement context. Save the observation date and keep different counting eras separate.
- Delivery. Capture impressions, members reached, frequency and network split where available.
- Response. Record engagements, clicks and a brief note about who responded and why it mattered.
Compute median impressions, median members reached and median frequency for a comparable group. Keep exceptional posts in the record, but don't let them define normal performance.
Decide what would count as progress
For your next ten posts, use a consistent topic family and format. Change the opening or the proof deliberately, then label each result expanding, saturating or skipped at a matching measurement point.
We offer scheduling, real-time statistics, best-post review, and recycling and repurposing through our Optimize, Schedule and Recycle tools. Those functions can support the routine, but you still need to decide what audience response you're trying to improve.
Keep the approach when median members reached improves and relevant responses hold up. If impressions rise without audience growth, don't call that wider discovery. If neither delivery nor response improves, change the opening or audience fit and test again.
Save follower counts with each result so audience growth doesn't get mistaken for better writing. The aim isn't to make every post beat the last. It's to find an approach that repeatedly puts useful work in front of the right people.
RedactAI helps you draft LinkedIn posts in your own voice, schedule them and review performance so you can test ideas consistently. Visit RedactAI to build your next publishing batch and judge it by audience growth and relevant engagement, not an isolated impression spike.