“Get more impressions” is weak advice if you use LinkedIn to win work. Say a consultant screenshots a huge reach spike, then checks the profile and finds barely any new visitors and no inbound messages. The post got distributed. That doesn't mean the right people became interested.
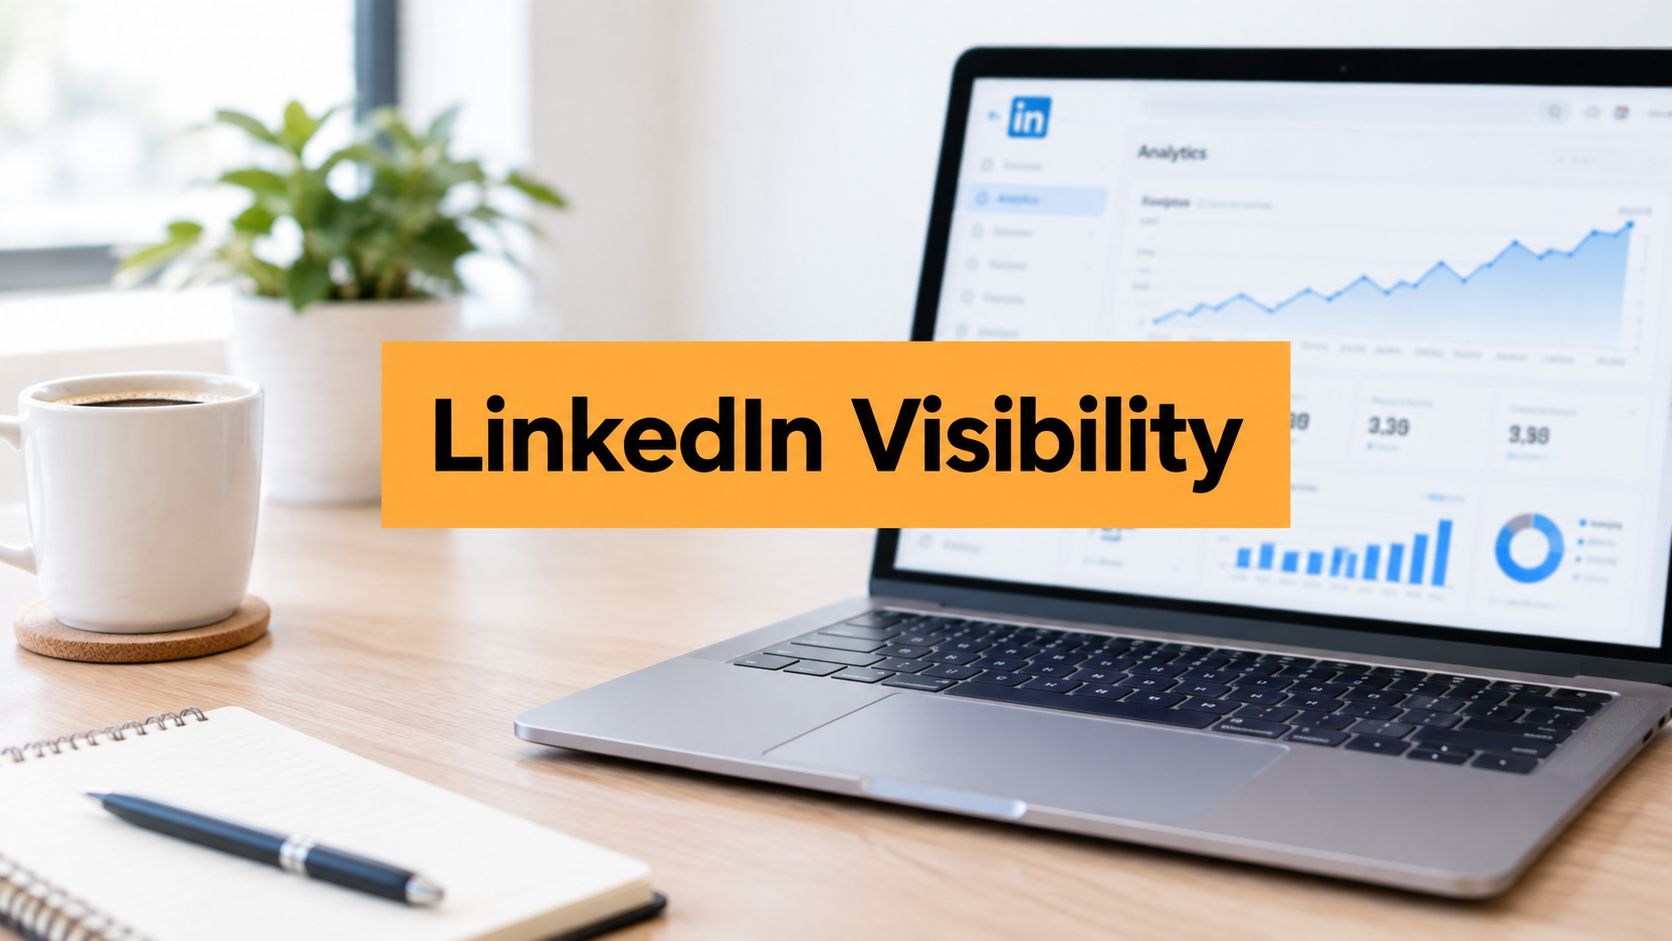
For LinkedIn analytics, personal profile performance needs a funnel, not a leaderboard. Track whether people discover you, consider your expertise, and start relevant conversations. Then change your posting based on the typical result, not your loudest outlier.
Profile Applause Is Not the Score
A popular post can be commercially useless. That's not a criticism of entertaining content. It's a reminder to judge content against the job you hired it to do.
LinkedIn's measurement guidance describes impressions as estimates of exposure, not precise evidence of attention or business impact. Members reached belongs to that same exposure category. Neither tells you whether someone understood your argument, trusted your expertise, or wanted a conversation.
Use this scorecard instead:
- Distribution: Impressions and reach show whether people had an opportunity to encounter the content.
- Audience fit: Demographics and profile visits help you assess whether relevant people showed interest.
- Intent: Follows, link clicks, messages, and qualified conversations show what people did next.
LinkedIn doesn't give personal-profile creators a native benchmark against their normal performance. An executive reshare or an unusually large second-degree audience can make a post look exceptional without making it repeatable.
Privacy also limits what you can know about individual viewers. Don't turn an unidentified visit into an imaginary prospect in your pipeline.
The useful question: Did this post move relevant people closer to a professional conversation?
For an executive, consultant, or salesperson, chasing out-of-market reach can waste effort and distort future topic choices. If your buyers need procurement advice, a broad workplace joke might attract applause while telling you little about demand for your services. Keep the business objective visible before you open the dashboard.
The Numbers on a Personal Profile
| Metric | What it counts | Kept for | Use it to judge |
|---|---|---|---|
| Profile appearances | Name and headline shown in search, posts, comments, and recommendations | Not stated | Discoverability |
| Profile views | People who open the profile to inspect experience, skills, and background | Not stated | Consideration |
| Impressions | Estimated times a post was displayed | Discovery counts available up to 1,000 days, according to LinkedIn's post analytics guide | Distribution, directional only |
| Members reached | People exposed to content, not proof they paid attention | Reached data available for 400 days under that guidance | Breadth of exposure |
| Engagements | Clicks, reactions, comments, and shares; some views also include saves, sends, and reposts | Social-engagement counts available up to 1,000 days for many formats under that guidance | Active response |
| Follower growth | New followers over the selected window | Not stated | Audience accumulation |
| Follower or viewer demographics | Audience characteristics in the breakdowns LinkedIn shows | Demographic breakdowns available for 180 days under that guidance | Audience fit; save before expiry |
Treat the table as a funnel, not a menu. Appearances put your name and headline in front of people. Views mean someone chose to inspect your experience, positioning, and proof. Follows and messages sit at the bottom, closest to a qualified conversation. Each stage answers a different question, so a strong number at the top never excuses a weak one below it.
Profile views are the stage worth obsessing over. A view is a deliberate move: the reader left the feed to check who you are. Context still matters, since a potential buyer and an unrelated job seeker both count as one view, which is why demographics sit next to views in the funnel rather than as a separate report.
Use each metric for a different decision
Impressions tell you about distribution, full stop. Engagements tell you about response, but break the total apart before interpreting it. A comment asking how you implemented something signals buying intent; a thumbs-up from a former colleague does not, and LinkedIn counts both as engagement.
Members reached separates breadth from repeated display. Read it as a ceiling on how many distinct people saw the post, never as a count of attentive readers.
Follower growth shows audience accumulation. Inspect who joined before celebrating the number. Matching new followers against your target roles, industries, and locations is the key job, and this guide to LinkedIn follower insights walks through that matching process. If your posting feeds a wider company strategy, Grou's LinkedIn measurement for B2B marketing teams covers the team-level side. Keep the personal-profile funnel separate from that reporting rather than merging unlike metrics into one score.
Save the context, not just the headline
Combined post analytics covers short posts, images, videos, events, polls, and articles. You can toggle between impressions and engagements and rank top posts by either measure, and those two rankings answer different questions. The most distributed post is rarely the one that made people respond.
- Capture demographics monthly: Export when available, or save screenshots with the reporting window visible, since those breakdowns expire.
- Preserve comparisons: Record the same fields over the same observation window for each post.
- Separate spikes from patterns: Look for topics that repeatedly attract suitable viewers, not an isolated jump.
Now the judgement part. A single viral post will lie to you. Take your last ten or so comparable posts, calculate the profile-view rate for each, and use the median as your baseline. Judge every new post against that median rather than against your best-ever number.
The spreadsheet cell worth filling this week is profile viewers attributed to recent posts ÷ those posts' impressions. Skip total profile traffic for this calculation, since it mixes in visits that your posts never caused.
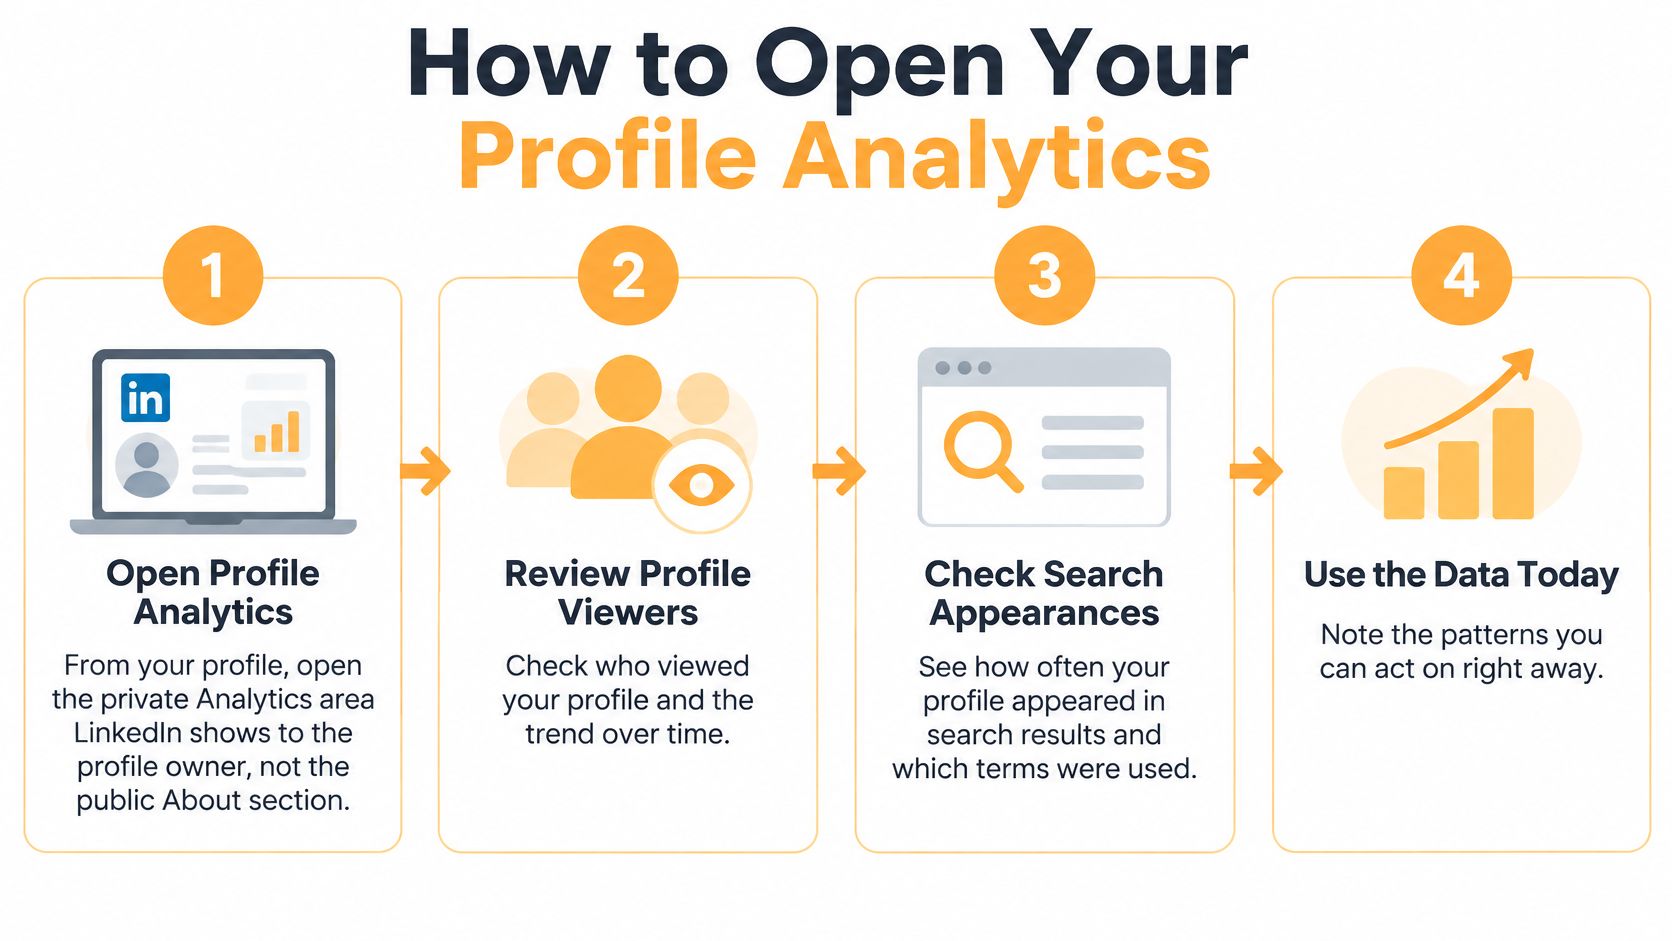
How to Open Your Profile Analytics
Start inside your own profile, not a company-page dashboard. You're looking for the private performance information LinkedIn shows the profile owner.
This visual gives you the navigation overview.
Follow the owner's analytics path
Open your profile's Analytics area. This isn't the public About section. Look for the owner-only analytics module, then open the available detail rather than stopping at the summary count.
Review profile viewers and search appearances side by side. Keep search visibility separate from overall profile appearances, which can include discovery elsewhere on LinkedIn. Label whatever the interface displays in your log instead of renaming everything “reach.”
Check what your account includes. Free members get basic view counts and limited visitor information. Premium members receive more visitor detail and behavioral insights. Upgrade only if that additional visibility would change a decision, not because you expect a subscription to improve the underlying content.
If fuller detail is missing, check activity volume before assuming something's broken. LinkedIn's profile analytics help indicates members generally need at least three unique profile viewers within seven days for fuller analytics. Publish useful material, contribute relevant comments, and return after activity has had time to develop. That threshold isn't a promise that every viewer will become identifiable.
Open analytics for a recent post. Switch between impressions and engagements, and use the default recent reporting window for an initial check. Note whether the leaders change when you change the sort. That difference is often more useful than the top-line total.
Open audience analytics and inspect the follower-growth trend alongside demographics. Save a dated copy so you can assess whether your publishing is attracting the audience you intended, rather than relying on memory.
Create a post-level log. Start with publication date and time, format, impressions, engagements, and profile viewers attributed to the post where available. Leave unavailable fields blank and label them unavailable. Missing information isn't the same as no activity.
Keep access separate from acquisition
More visitor detail can help you prioritize investigation, but it doesn't tell you whether someone needs your service. Qualify interest through the person's role, the relevance of their question, and the substance of any conversation.
If you're also assessing outreach support, Ever Outbound Inc.’s resource on client acquisition with no upfront fees addresses a separate acquisition route. Keep outreach activity distinct from post-attributed results so you don't credit organic content for every conversation.
A dashboard gives you observations. Your log should give you a decision.
Don't spend the session admiring charts. Leave with comparable post records and a clear note about which fields LinkedIn made available.
Read Views Against Reach
Use a consistent denominator before you compare anything. A percentage without a defined numerator and denominator is an invitation to draw the wrong conclusion.
Keep the math consistent
| Ratio | Calculation | Question it answers |
|---|---|---|
| Engagement rate | Total interactions ÷ impressions | Did exposure produce a response? |
| Profile-view rate | Distinct post-attributed profile viewers ÷ impressions | Did exposure produce consideration? |
| Qualified-action rate | Relevant follows, connection requests, messages, or booked conversations ÷ profile viewers | Did consideration produce a relevant next step? |
Read the three ratios as a funnel: exposure first, consideration second, conversation last. A post can win the top stage and lose everything below it, which is why raw impression counts make a poor scoreboard.
Record which interactions your analytics view includes, and check LinkedIn's documentation on post-performance metrics when you set up the log so your definitions match what the dashboard counts. Don't compare a reactions-and-comments numerator with a later total that also includes clicks, saves, or sends.
Set a rolling baseline, roughly your last month of posting, and compare medians across about ten comparable posts so one outlier can't set the standard for everything else. Match topic, audience, and format closely enough that the comparison means something.
This funnel visual keeps the exposure and consideration calculations distinct.
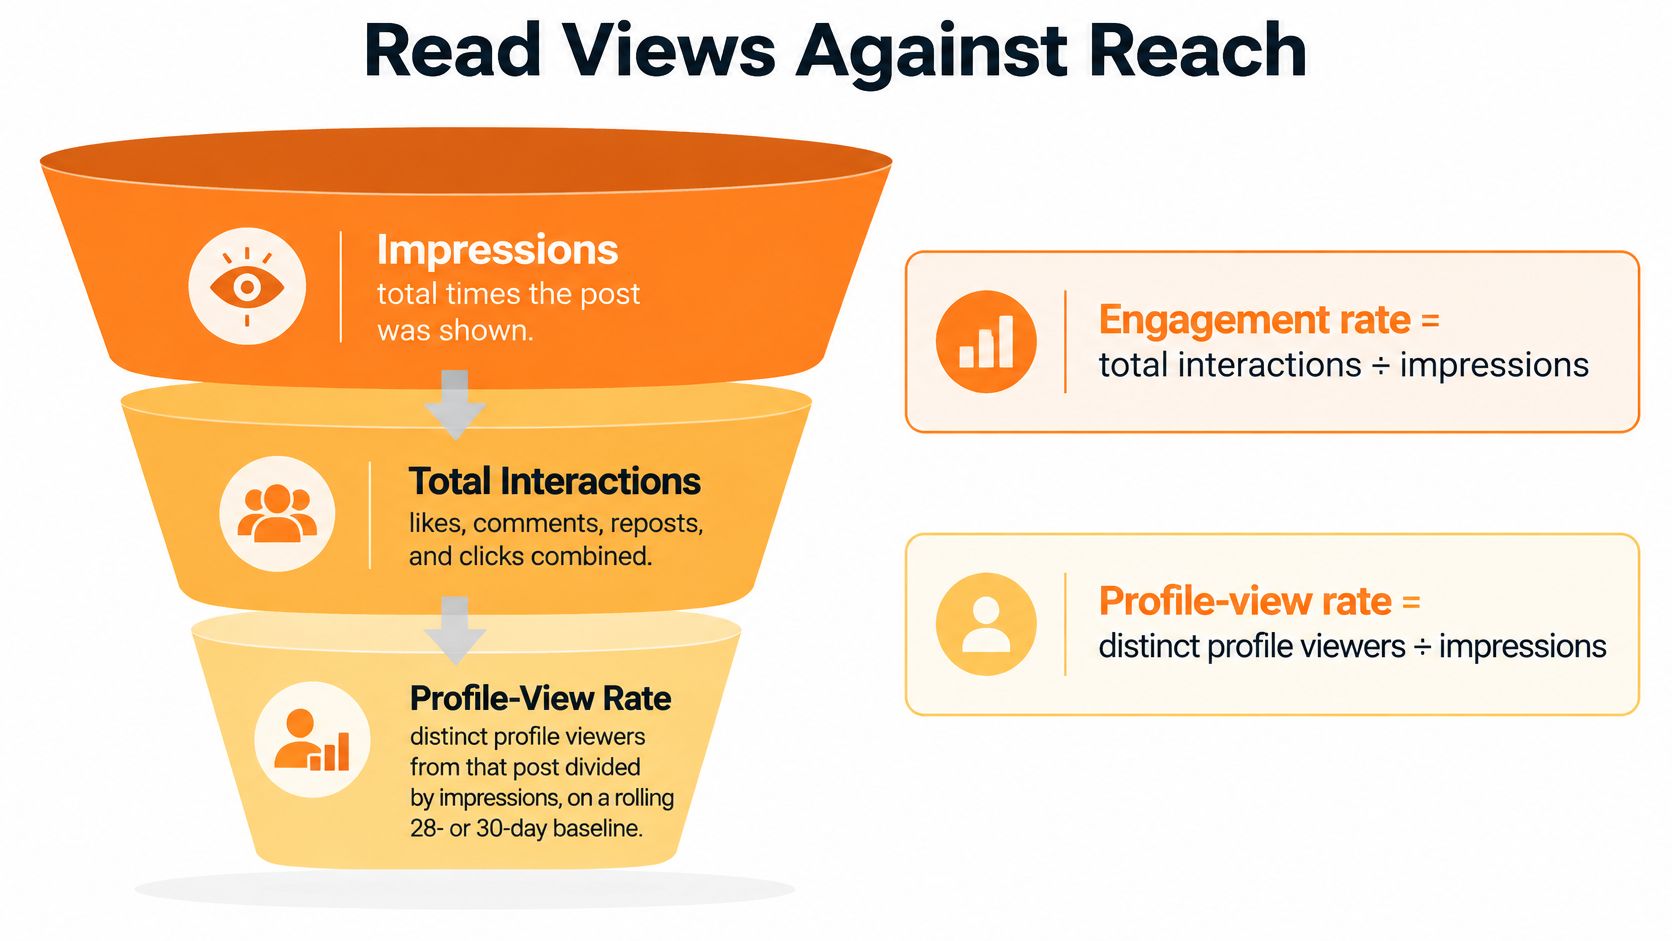
For a hypothetical worked example, suppose a post receives 4,000 impressions, 120 engagements, 36 distinct profile viewers, and 3 qualified actions. The resulting engagement rate is 3.0%, profile-view rate is 0.9%, and qualified-action rate is 8.3%, calculated as qualified actions divided by profile viewers. Judged alone, the 3.0% looks healthy; judged against the funnel, the 0.9% profile-view rate is the number that decides whether the post created consideration.
Those are illustrative calculations, not performance targets. Define a qualified action before reviewing results, and avoid double-counting someone who follows, connects, and then messages.
Diagnose the weak transition
| Pattern | Usual meaning | Inspect next |
|---|---|---|
| High impressions, few profile views | Distribution reached people who aren't considering you | Audience fit and whether the post gives a reason to inspect the profile |
| Strong reactions, no messages or follows | Existing connections may have enjoyed it without developing intent | Call to action and whether the topic matches buyers |
| Profile views up, follows and messages flat | People looked but didn't take the next step | Headline, About section, and featured proof |
| Out-of-network spike, follower count flat | A reshare or news moment may explain the jump | Viewer relevance before repeating the topic |
| In-network impressions only | Distribution stayed among familiar people | Hook and format, if new discovery is the objective |
Treat these as diagnostic hypotheses, not verdicts. Check the audience and content before rewriting your entire strategy.
Where available, separate in-network from out-of-network impressions. The former helps assess penetration among familiar people; the latter helps assess discovery. This explanation of LinkedIn post impressions helps keep distribution terminology straight.
Because impressions are estimates, tiny rate differences aren't reliable grounds for declaring a winner. Historical engagement totals can also change when reactions disappear or comments are deleted, so record when you captured the figures.
Prefer a repeatable rise in relevant consideration over a record reaction count.
Use the median of individual post rates, not the ratio of all combined totals. The latter lets the largest post dominate again. And don't treat repeated visits from a single person as a pipeline full of different prospects.
Run the One-Variable Test and Friday Review
The test should fit inside your existing publishing routine. Start with a spreadsheet you'll maintain, not an elaborate dashboard you'll abandon.
Set aside a focused review session before you draft the next batch.

Write the variable before writing the posts
Add content pillar, hook style, call to action, rough word count, and qualified actions to your post log. Keep format and publication timestamp visible. Use a consistent observation age so an older post doesn't get an unfair advantage over a newly published update.
A LinkedIn analytics report template can give that log a reusable structure. Keep the working sheet narrow enough that you can see both the content characteristics and the resulting rates without hunting through tabs.
Choose a variable deliberately:
- Opening hook: Compare a direct problem statement with an outcome-led opening while keeping the topic and audience stable.
- Posting time: Keep the content approach steady and vary the publication slot.
- Call to action: Test a relevant question against a specific invitation to continue the discussion.
- Format: Compare presentation styles without simultaneously changing the subject, length, and audience promise.
Don't test all of these together. If you change the hook, format, topic, and posting time, you won't know which change deserves credit.
Use the video as a separate viewing break, then return to the sheet with your chosen variable written at the top.
Make Friday a decision meeting
Choose fixed publishing days that suit your workload and review every Friday. Check whether the records are complete, whether the intended audience showed up, and whether relevant actions can reasonably be connected to the posts.
Don't declare a winning time slot because it produced the largest display count. When slots look similar, prefer the audience that matches your target market. If visitor detail is sparse, mark the result inconclusive rather than inventing a conversion story.
Use a short review note:
- Keep: The content choice that repeatedly attracts relevant profile interest.
- Investigate: A weak transition, such as visits without a clear next action.
- Test: The specific variable you'll change while leaving the other meaningful choices alone.
At RedactAI, we write posts in your authentic voice learned from your previous posts, and our Optimize, Schedule and Recycle tools support scheduling, real-time statistics, reviewing best posts, and repurposing content. That can reduce publishing friction, but it doesn't replace deciding what a useful result means.
This week, choose the opening hook as your variable and put Friday's review on your calendar. Keep your topic and target audience steady, record the results consistently, and resist copying the viral outlier just because it looks good in a screenshot.
RedactAI helps you turn a measured content decision into posts written in your own voice, with scheduling and statistics to support a consistent routine. Visit RedactAI to prepare your next comparable batch, then judge it by relevant profile interest and qualified conversations rather than impressions alone.